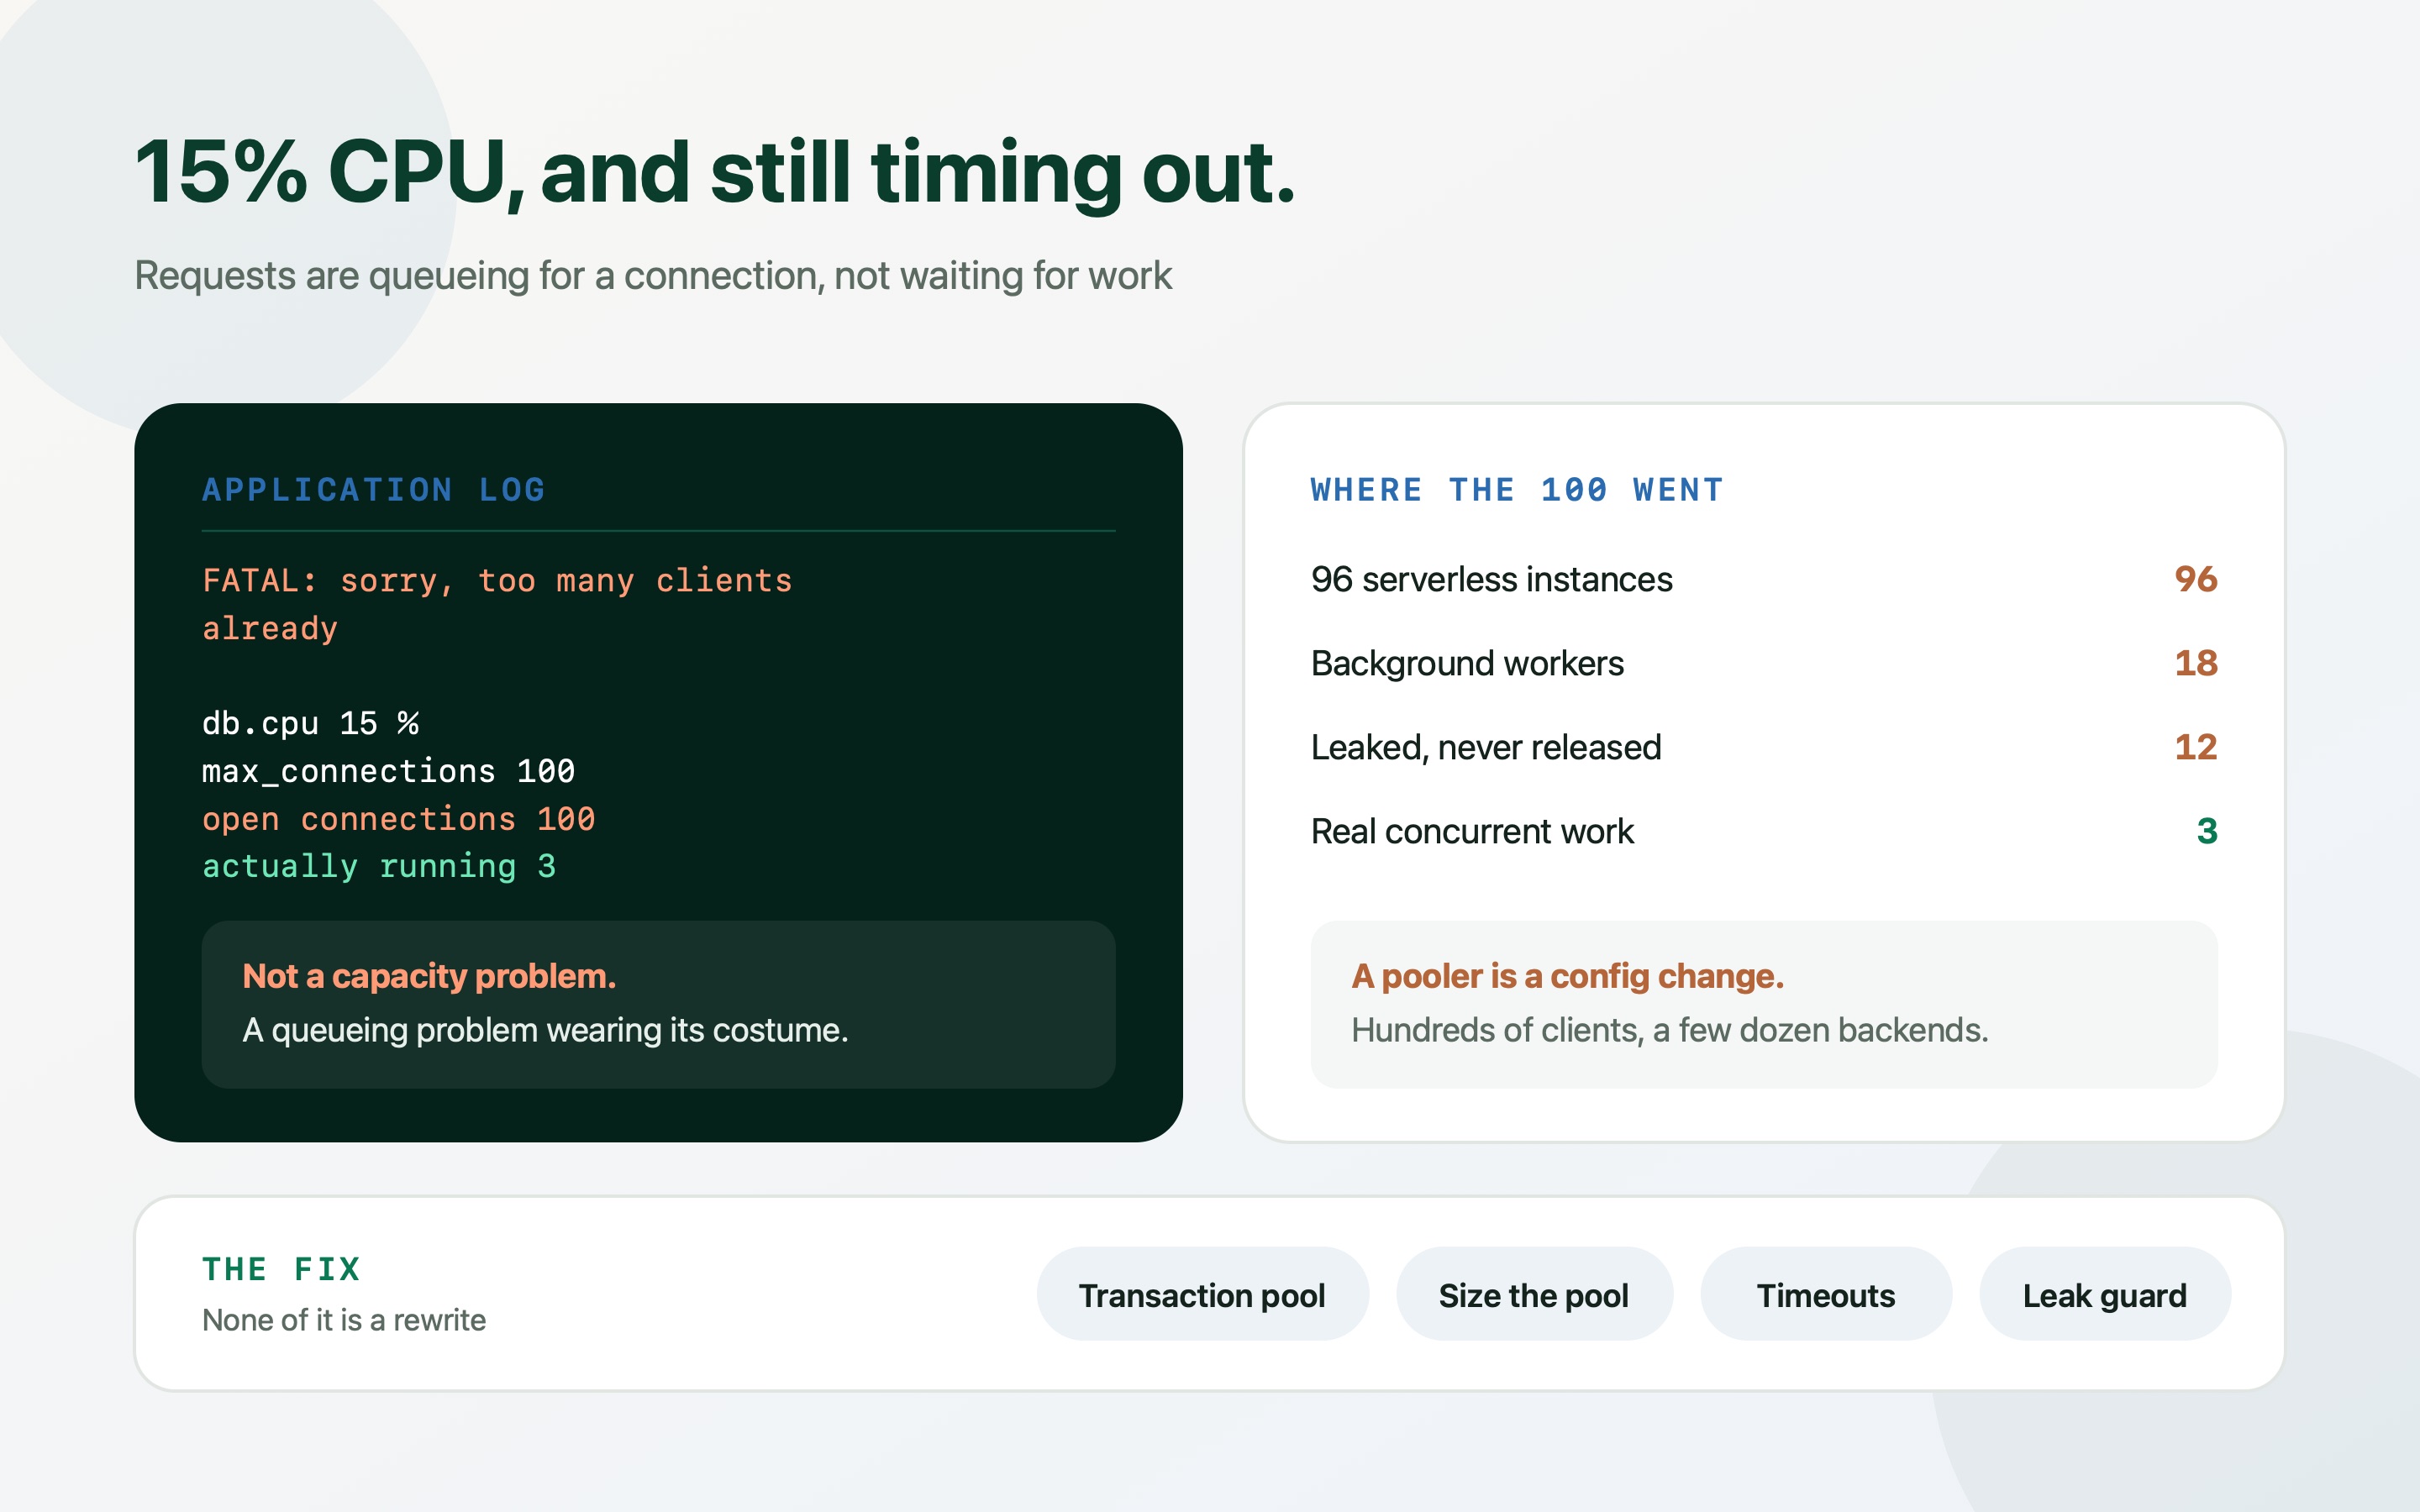
A database refusing work while running at fifteen percent CPU is telling you something precise: requests are not waiting for the database, they are waiting for permission to talk to it.
This one has a season. It arrives at month-end, on flash-sale day, or the morning after a feature goes on the homepage — traffic doubles, and instead of getting slower the application starts throwing.
The error is almost always the same: “sorry, too many clients already”, or a pool acquire timeout from the application side. Someone raises max_connections, it holds for a week, and then the database falls over harder because each of those connections costs memory.
Postgres allocates a backend process per connection, so max_connections is a ceiling you cannot raise your way out of. The real fix is three changes that are all configuration: put a transaction-mode pooler in front, size the application pool deliberately, and add the timeouts that stop connections leaking. None of it touches your business logic.
The signature: errors with an idle database
Before changing anything, confirm the shape. Connection exhaustion looks nothing like a slow database, and the two have opposite fixes. Exhaustion shows low CPU, low disk activity, a connection count pinned at the limit, and almost no sessions actually executing anything.
Count connections by state and by application. The interesting number is not the total — it is how many are `active` versus `idle` versus `idle in transaction`. A hundred connections of which three are running queries is the whole diagnosis in one row.
`idle in transaction` deserves its own alarm. Those sessions have an open transaction, hold any locks they took, and block the vacuum horizon for the entire database. They are not waiting on the database; the database is waiting on your application.
Low database CPU with connection errors means queueing, not capacity. Buying a bigger instance raises max_connections a little and costs you every month — it does not fix the pattern that consumed them.
SELECT
  state,
  count(*),
  max(now() - state_change)      AS longest_in_state,
  array_agg(DISTINCT application_name) FILTER (
    WHERE application_name <> ''
  )                              AS apps
FROM pg_stat_activity
WHERE backend_type = 'client backend'
GROUP BY state
ORDER BY count(*) DESC;

--       state        | count | longest_in_state |          apps
-- ------------------+-------+------------------+---------------------------
--  idle             |    79 | 00:41:12         | {api,worker,cron}
--  idle in transaction |  12 | 00:06:38         | {api}          <- bug
--  active           |     3 | 00:00:00.41      | {api}
--
-- 94 connections. Three doing work. The database is not the bottleneck.

-- And the ceiling you are hitting:
SHOW max_connections;
SELECT count(*) FROM pg_stat_activity;Where the connections actually went
Every exhaustion incident I have worked resolves into some combination of five sources, and it is worth counting each one before choosing a fix. The arithmetic is usually embarrassing: the number of connections that exist has no relationship to the amount of concurrent work being done.
Serverless is the sharpest version. Each cold function instance opens its own pool, so a traffic spike that starts fifty instances opens fifty pools — and a pool with a default max of ten means five hundred connections for work that needs a handful. This is the single most common way a quickly-scaffolded backend falls over, because the default in most tutorials is a client per invocation.
The subtler sources are the ones nobody counts: background workers with their own pools, cron containers that connect on boot and never disconnect, migration tooling left running in a terminal, monitoring agents, and connections leaked by error paths that return before releasing.
| Source | Typical count | What to do about it |
|---|---|---|
| Serverless instances, one pool each | 1–5 per concurrent instance, multiplied by instance count | Pool max of 1–2 per instance, a client at module scope, and a pooler in front. This is the big one. |
| Long-running API containers | Pool max × replica count | Size deliberately (below), and make sure the pool is shared across the process rather than per request. |
| Background workers and cron | Often as many as the API, and always forgotten | Give them their own, smaller pool and their own application_name so they are visible in pg_stat_activity. |
| Leaked connections | Grows steadily until restart | Release in a finally block; add an acquire timeout so a leak surfaces as an error rather than a hang. |
| Humans and tools | 2–10, invisible until they matter | Reserve superuser connections so you can still get in when the application has taken everything. |
Pool sizing: the right number is smaller than you think
The instinct is that a bigger pool serves more traffic. It does not. Once every database core is busy, extra connections add context switching and memory pressure, and throughput goes down. A pool exists to keep the database busy, not to represent your users.
Start from throughput rather than from users. If the average query takes 5ms, one connection serves roughly 200 queries a second. Ten connections serve two thousand. Almost no early-stage application needs more than that, and if yours appears to, the query time is the thing to fix.
Then check the total. Add up every pool in every process — API replicas, workers, cron, migrations — and make sure it sits comfortably under max_connections, leaving headroom for superuser access and maintenance. The moment that sum exceeds the ceiling, you have designed an outage that only needs a deploy to trigger.
- A connection timeout is not optional: Without connectionTimeoutMillis a request waits indefinitely for a free connection, so exhaustion presents as a total hang rather than an error you can alert on.
- Size workers separately from the API: Workers do long, chunky work; APIs do short, frequent work. One pool setting for both is how one of them starves the other.
- Set application_name everywhere: It costs nothing and turns the next incident from guesswork into a GROUP BY. Include the process type and the release.
// Throughput per connection = 1000 / avg_query_ms
//   5ms  ->  200 queries/sec per connection
//   10 connections -> ~2,000 queries/sec of database work
//
// Total across the fleet must fit under the ceiling:
//   8 API replicas  x 10 = 80
//   2 worker procs  x  5 = 10
//   1 cron          x  2 =  2
//   humans + tools        =  5
//                          ---
//                           97   against max_connections = 100   <- too tight
//
// Either cut the per-process max, or put a pooler in front so these
// numbers stop being real database connections at all.

const pool = new Pool({
  max: 10,                       // per process, not per fleet
  min: 0,                        // do not hold connections you are not using
  idleTimeoutMillis: 30_000,     // give them back
  connectionTimeoutMillis: 5_000,// fail fast instead of hanging forever
  application_name: 'api',       // so pg_stat_activity can tell you who is who
  statement_timeout: 15_000,     // a runaway query cannot hold a slot all day
  idle_in_transaction_session_timeout: 10_000,
})

// Serverless is the exception: max 1, created once at module scope so it
// is reused across invocations on the same warm instance.Put a transaction-mode pooler in front
A pooler multiplexes many application connections onto a few real database backends. In transaction mode, a client only holds a server connection for the duration of a transaction, which means a few dozen backends can serve hundreds or thousands of application clients. On managed Postgres this is PgBouncer, RDS Proxy, or the pooler your provider already offers.
This is a configuration change, not a code change — but transaction mode has real constraints, and hitting one in production is unpleasant. Anything that depends on session state breaks: `SET` statements that outlive a transaction, `LISTEN`/`NOTIFY`, session-level advisory locks, temporary tables, and cursors held across transactions.
Protocol-level prepared statements are the one that bites hardest, because ORMs use them by default. PgBouncer gained support for them in recent versions, but if you are on an older build or a provider that has not enabled it, disable statement caching in your driver. Test this deliberately: the failure is intermittent and looks like a driver bug.
[databases]
app = host=db.internal port=5432 dbname=app

[pgbouncer]
listen_addr = 0.0.0.0
listen_port = 6432
auth_type = scram-sha-256
auth_file = /etc/pgbouncer/userlist.txt

pool_mode = transaction          ; the whole point; session mode saves nothing

; Real backends to the database. Small on purpose.
default_pool_size = 25
reserve_pool_size = 5
reserve_pool_timeout = 3

; Client-side capacity. This is what your fleet connects to.
max_client_conn = 2000

; Do not let a client hold a server connection forever.
server_idle_timeout = 60
query_wait_timeout = 10          ; queue, then fail — never hang indefinitely

; Required on PgBouncer < 1.21, or with any driver whose prepared-statement
; support you have not explicitly verified in transaction mode:
; max_prepared_statements = 0    ; and disable statement caching in the driver

; Watch it like you watch the database:
;   SHOW POOLS;   -> cl_waiting > 0 means clients are queueing for a backend
; SHOW STATS;| Feature | Why it breaks | Alternative |
|---|---|---|
| SET / session variables | The next statement may land on a different backend | SET LOCAL inside the transaction, or pass the value per query. |
| LISTEN / NOTIFY | Requires a persistent session | A separate direct connection for the listener, or move to a real queue. |
| Session advisory locks | The session ends at commit | Transaction-scoped advisory locks (pg_advisory_xact_lock). |
| Temporary tables | Scoped to a session you no longer own | CTEs, or an unlogged table keyed by request id. |
| Protocol prepared statements | Prepared on one backend, executed on another | PgBouncer 1.21+ handles this; otherwise disable the driver's statement cache. |
Stop the leaks that refill the pool
A pooler hides a leak for a while, then makes the eventual failure more confusing. Worth an hour to find them properly.
The classic leak is an error path that returns before releasing. Any code that acquires a client explicitly must release it in a `finally`, without exception — and in most applications the better answer is to stop acquiring explicitly at all, and use the pool's query helper or a transaction wrapper that handles release for you.
The second classic is holding a connection across work that is not database work. A transaction that stays open while you call a payment provider holds a server connection, a snapshot and any locks for the duration of someone else's latency. Get external calls out from between BEGIN and COMMIT.
Then let the database defend itself. `idle_in_transaction_session_timeout` bounds the damage from a leaked transaction; `statement_timeout` bounds a runaway query. Both are one-line settings and both turn a slow-motion outage into a logged error.
// LEAK: early return skips release()
async function badHandler(req, res) {
  const client = await pool.connect()
  const user = await client.query('SELECT ...')
  if (!user.rows.length) return res.status(404).end()   // connection gone
  client.release()
}

// SAFE: release in finally, always
async function goodHandler(req, res) {
  const client = await pool.connect()
  try {
    const user = await client.query('SELECT ...')
    if (!user.rows.length) return res.status(404).end()
  } finally {
    client.release()
  }
}

// BETTER: never hold one yourself
const user = await pool.query('SELECT ...')

// And never hold a transaction across a network call you do not control:
await pool.query('BEGIN')
await paymentProvider.charge(order)     // 800ms of someone else's latency
await pool.query('COMMIT')              // held a backend the whole time

// Database-side backstops, set once:
//   ALTER ROLE app SET idle_in_transaction_session_timeout = '10s';
// ALTER ROLE app SET statement_timeout = '15s';Survive the spike instead of collapsing under it
Even with a pooler and a sensible pool, there is a load at which demand exceeds what the database can do. The difference between a degraded system and an outage is whether you shed that load deliberately.
Limit concurrency at the edge of your application, before the pool. A semaphore that caps in-flight database work per process, with a short queue and a fast rejection, keeps the pool healthy and turns overload into a handful of 429s instead of a total stall. Return `Retry-After` and let clients back off.
Autoscaling deserves a second look too. Scaling API replicas on CPU during a database bottleneck adds connections to a database that has none to give — it accelerates the failure. Scale on queue depth or request latency, cap the replica count at what the connection budget allows, and make the cap explicit in your infrastructure code so nobody raises it by accident at 2am.
- Cap in-flight work per process: A small semaphore around database calls, sized near the pool max. Requests beyond it get a fast 429 rather than sitting on a connection queue.
- Never autoscale replicas past the connection budget: Max replicas × pool max must stay under what the pooler and database can serve. Write the arithmetic in a comment next to the autoscaling rule.
- Reserve connections for operators: superuser_reserved_connections exists so you can still connect during an incident. Confirm you can actually get in before you need to.
- Fail fast, everywhere: Acquire timeout, statement timeout, pooler query_wait_timeout. Every hang you convert into an error is an alert you can act on.
Confirm it, then watch the right number
Reproduce the failure before you fix it: drive the endpoint at the concurrency that broke it and watch connection count, `cl_waiting` on the pooler, and error rate together. If you cannot reproduce it, you cannot know which change helped.
Then keep two numbers on a dashboard permanently. Connections in use as a percentage of the ceiling tells you how close to the edge you are living. Clients waiting for a server connection tells you when you have arrived. Both are cheap to collect and neither appears on a default monitoring setup.
The representative run below is what a fixed system looks like: the same traffic, a fraction of the connections, and errors replaced by a slightly higher p95.
Database CPU going up after the fix is the point. Before, the instance was idle because nothing could reach it. Utilisation is what you were paying for all along.
| Measure | Before | After |
|---|---|---|
| Peak database connections | 100 (ceiling) | 24 |
| Connection errors in 10 minutes | 2,140 | 0 |
| p95 latency at peak | timeout | 310 ms |
| Database CPU at peak | 15% | 58% |
| Application replicas | 8, scaling on CPU | 8, capped by connection budget |
Frequently asked questions
Why does my database time out when CPU is low?
Requests are waiting for a connection rather than for work. Postgres allocates a process per connection, so max_connections is a hard ceiling, and once it is reached new clients are refused regardless of how idle the instance is. Count connections by state in pg_stat_activity: if most are idle and only a handful are active, you have a queueing problem, not a capacity one.
Should I just increase max_connections?
Rarely more than once, and never as the actual fix. Each connection costs memory and adds context-switching overhead, so past a few hundred the instance gets slower rather than more capable. Raising it buys time to install a transaction-mode pooler, which is the change that actually removes the ceiling as a constraint.
How many connections should my application pool have?
Fewer than you expect. Work from throughput: at a 5ms average query, one connection serves roughly 200 queries a second, so ten connections per process covers a great deal of traffic. Then check the fleet total — replicas × pool max, plus workers, cron and humans — stays comfortably under the ceiling. If the sum is close, cut the per-process max or add a pooler.
PgBouncer transaction mode or session mode?
Transaction mode, unless you depend on session state. Session mode holds a backend for the whole client connection, which saves almost nothing. Transaction mode is where the multiplexing happens — at the cost of SET, LISTEN/NOTIFY, session advisory locks and temporary tables, and with care needed around protocol-level prepared statements on older PgBouncer versions.
Why does serverless exhaust connections so quickly?
Every cold instance opens its own pool, and a spike starts many instances at once. Fifty instances with a default pool of ten is five hundred connections for work that needs a dozen. Set the pool max to one or two, create the client at module scope so warm invocations reuse it, and put a pooler or RDS Proxy between the functions and the database.
How do I find a connection leak?
Look for connections whose state has not changed in minutes, grouped by application_name — a leak shows as a steadily growing count of idle or idle-in-transaction sessions that only resets on deploy. In code, the cause is nearly always an acquire without a release in a finally, or a transaction held across a call to an external service. Setting idle_in_transaction_session_timeout turns the leak into a logged error instead of a slow outage.