The slow query you were told about is usually not the one costing you money. Production has the answer already — it just needs three settings turned on and four questions asked in the right order.
Almost every slow-database engagement starts the same way: someone pastes a query into Slack, somebody else suggests an index, and a week later the p95 has not moved. The query was real, the index was reasonable, and neither was the problem.
Diagnosis fails at the first step, not the last. Production is measuring nothing, so the only evidence available is whatever a human happened to notice — which biases you towards queries that are individually slow and away from the ones that are merely slow a hundred thousand times an hour.
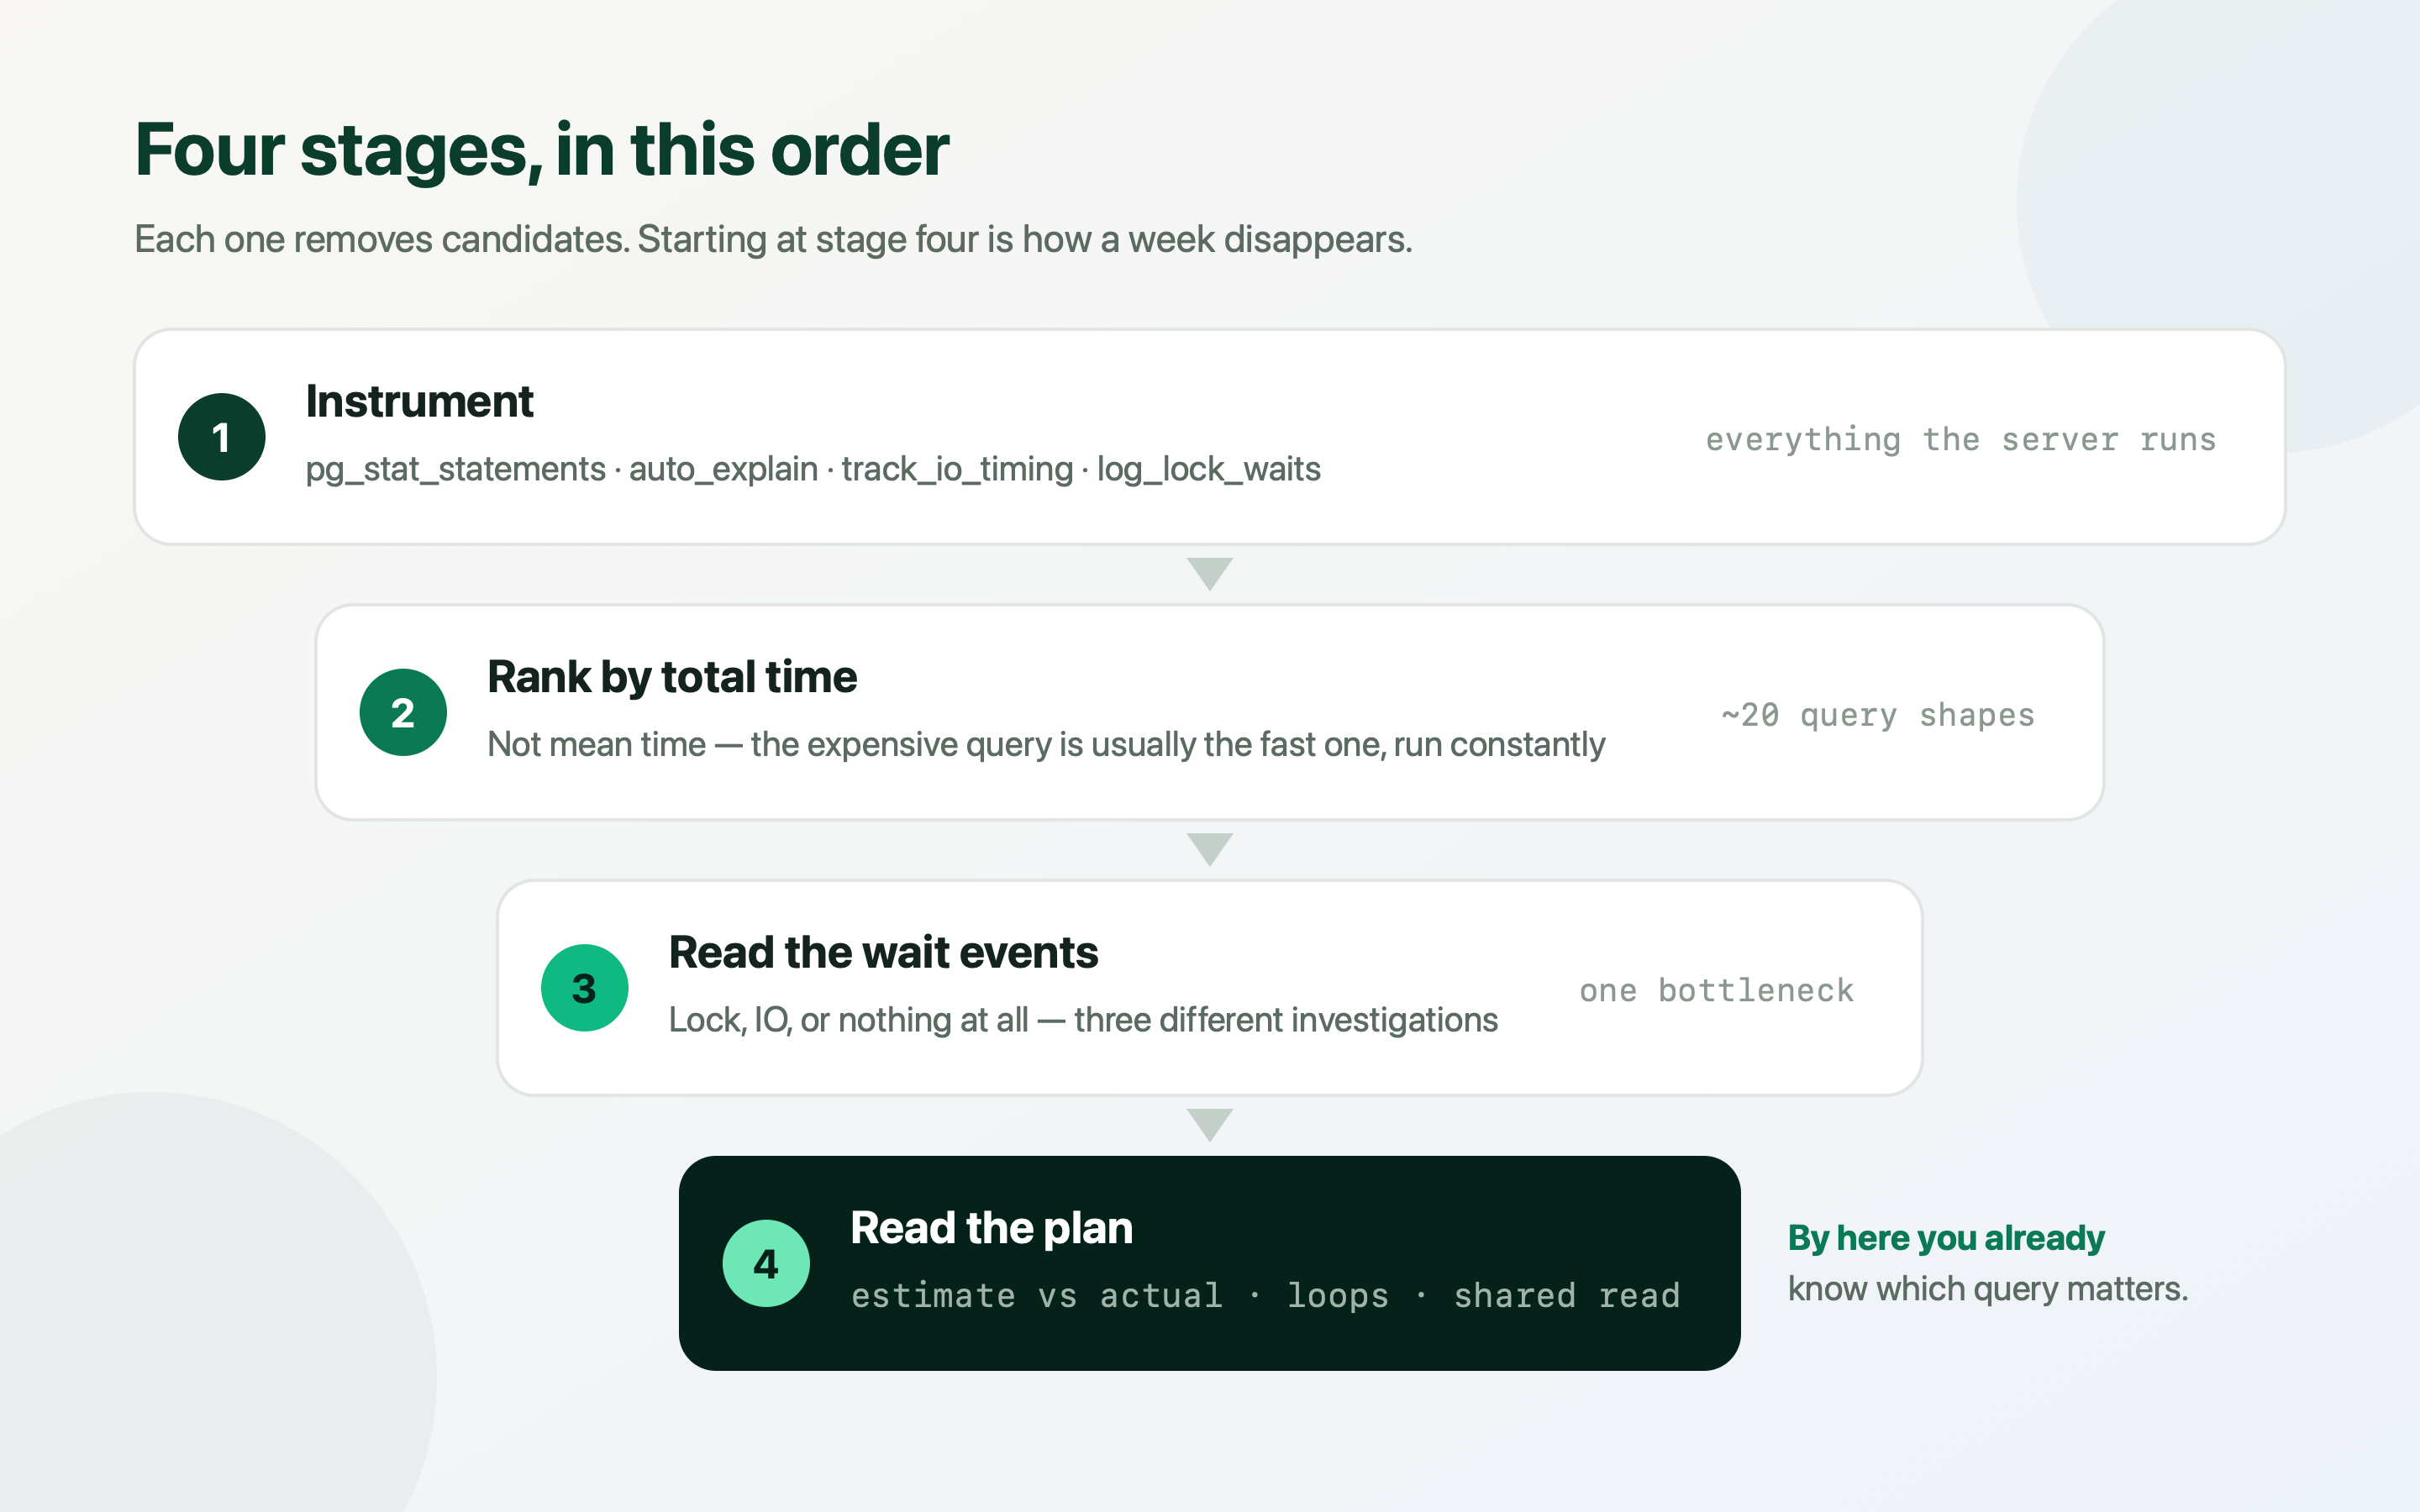
This is the order I work in on live systems: turn on the instrumentation that costs almost nothing, rank by total time, look at what the database is waiting on right now, and only then read a plan. By the time you reach the plan, you already know which query matters and roughly why.
First decide what “slow” means here
“The database is slow” is not a diagnosis, and neither is a screenshot of one query. Before touching Postgres, get two numbers from the application side: which endpoint degraded, and at what percentile. A p50 that moved from 80ms to 110ms is a different investigation from a p99 that moved from 300ms to 14 seconds.
The percentile matters because it tells you the shape of the fault. Means move when work genuinely gets heavier — more rows, more users, more data per request. Tails move when something serialises: a lock, a pool, an occasional bad plan, an autovacuum that never ran. The first is capacity, the second is contention, and they have almost nothing in common.
Also fix the window you are comparing. “Slow since Tuesday” is a deploy, a data migration, or a plan flip. “Slowly getting worse for two months” is growth, bloat, or an index that stopped fitting in memory. Write down which one you are looking at before you start, because every later piece of evidence is ambiguous without it.
If nobody can tell you which endpoint got slow and at which percentile, that is the first thing to fix. You cannot confirm a database fix you have no way to measure.
Turn on the three things that make diagnosis possible
Postgres will tell you almost everything, but only if asked in advance. These three settings are the difference between a diagnosis and an argument, and on a normally loaded system the overhead is in the low single digits of percent.
pg_stat_statements aggregates every query the server has run, normalised by shape, with call counts and total time. auto_explain logs the actual plan of anything slower than a threshold, which is how you catch the plan a query used at 3am and refuses to use again. track_io_timing separates time spent waiting on disk from time spent doing work.
Set them once, restart, and leave them on. The most expensive moment in any performance investigation is discovering that the interesting event happened yesterday and nothing recorded it.
- auto_explain.log_analyze has a real cost: It instruments execution, which on very high-frequency queries can add measurable overhead. Sample it at 0.1–0.25 on a busy server; that is still hundreds of plans an hour.
- log_lock_waits is free evidence: Every wait longer than deadlock_timeout gets logged with the blocking statement. This single line often ends an investigation that would otherwise take a day.
- On RDS or Cloud SQL these are parameter-group changes: Same settings, different surface. Performance Insights is a reasonable substitute for the live view, but it does not replace pg_stat_statements for ranking.
# Requires a restart: both libraries load at server start.
shared_preload_libraries = 'pg_stat_statements,auto_explain'

# Aggregate stats for every normalised query shape.
pg_stat_statements.max = 10000
pg_stat_statements.track = top

# Log the real plan for anything over 500ms, with row counts and buffers.
auto_explain.log_min_duration = '500ms'
auto_explain.log_analyze = on
auto_explain.log_buffers = on
auto_explain.log_nested_statements = on
auto_explain.sample_rate = 0.25   # 1.0 while investigating, lower when busy

# Separate disk wait from CPU work.
track_io_timing = on

# A plain slow-query log is still worth having alongside the above.
log_min_duration_statement = '1s'
log_lock_waits = on
log_autovacuum_min_duration = '1s'Rank by total time — the expensive query is rarely the slow one
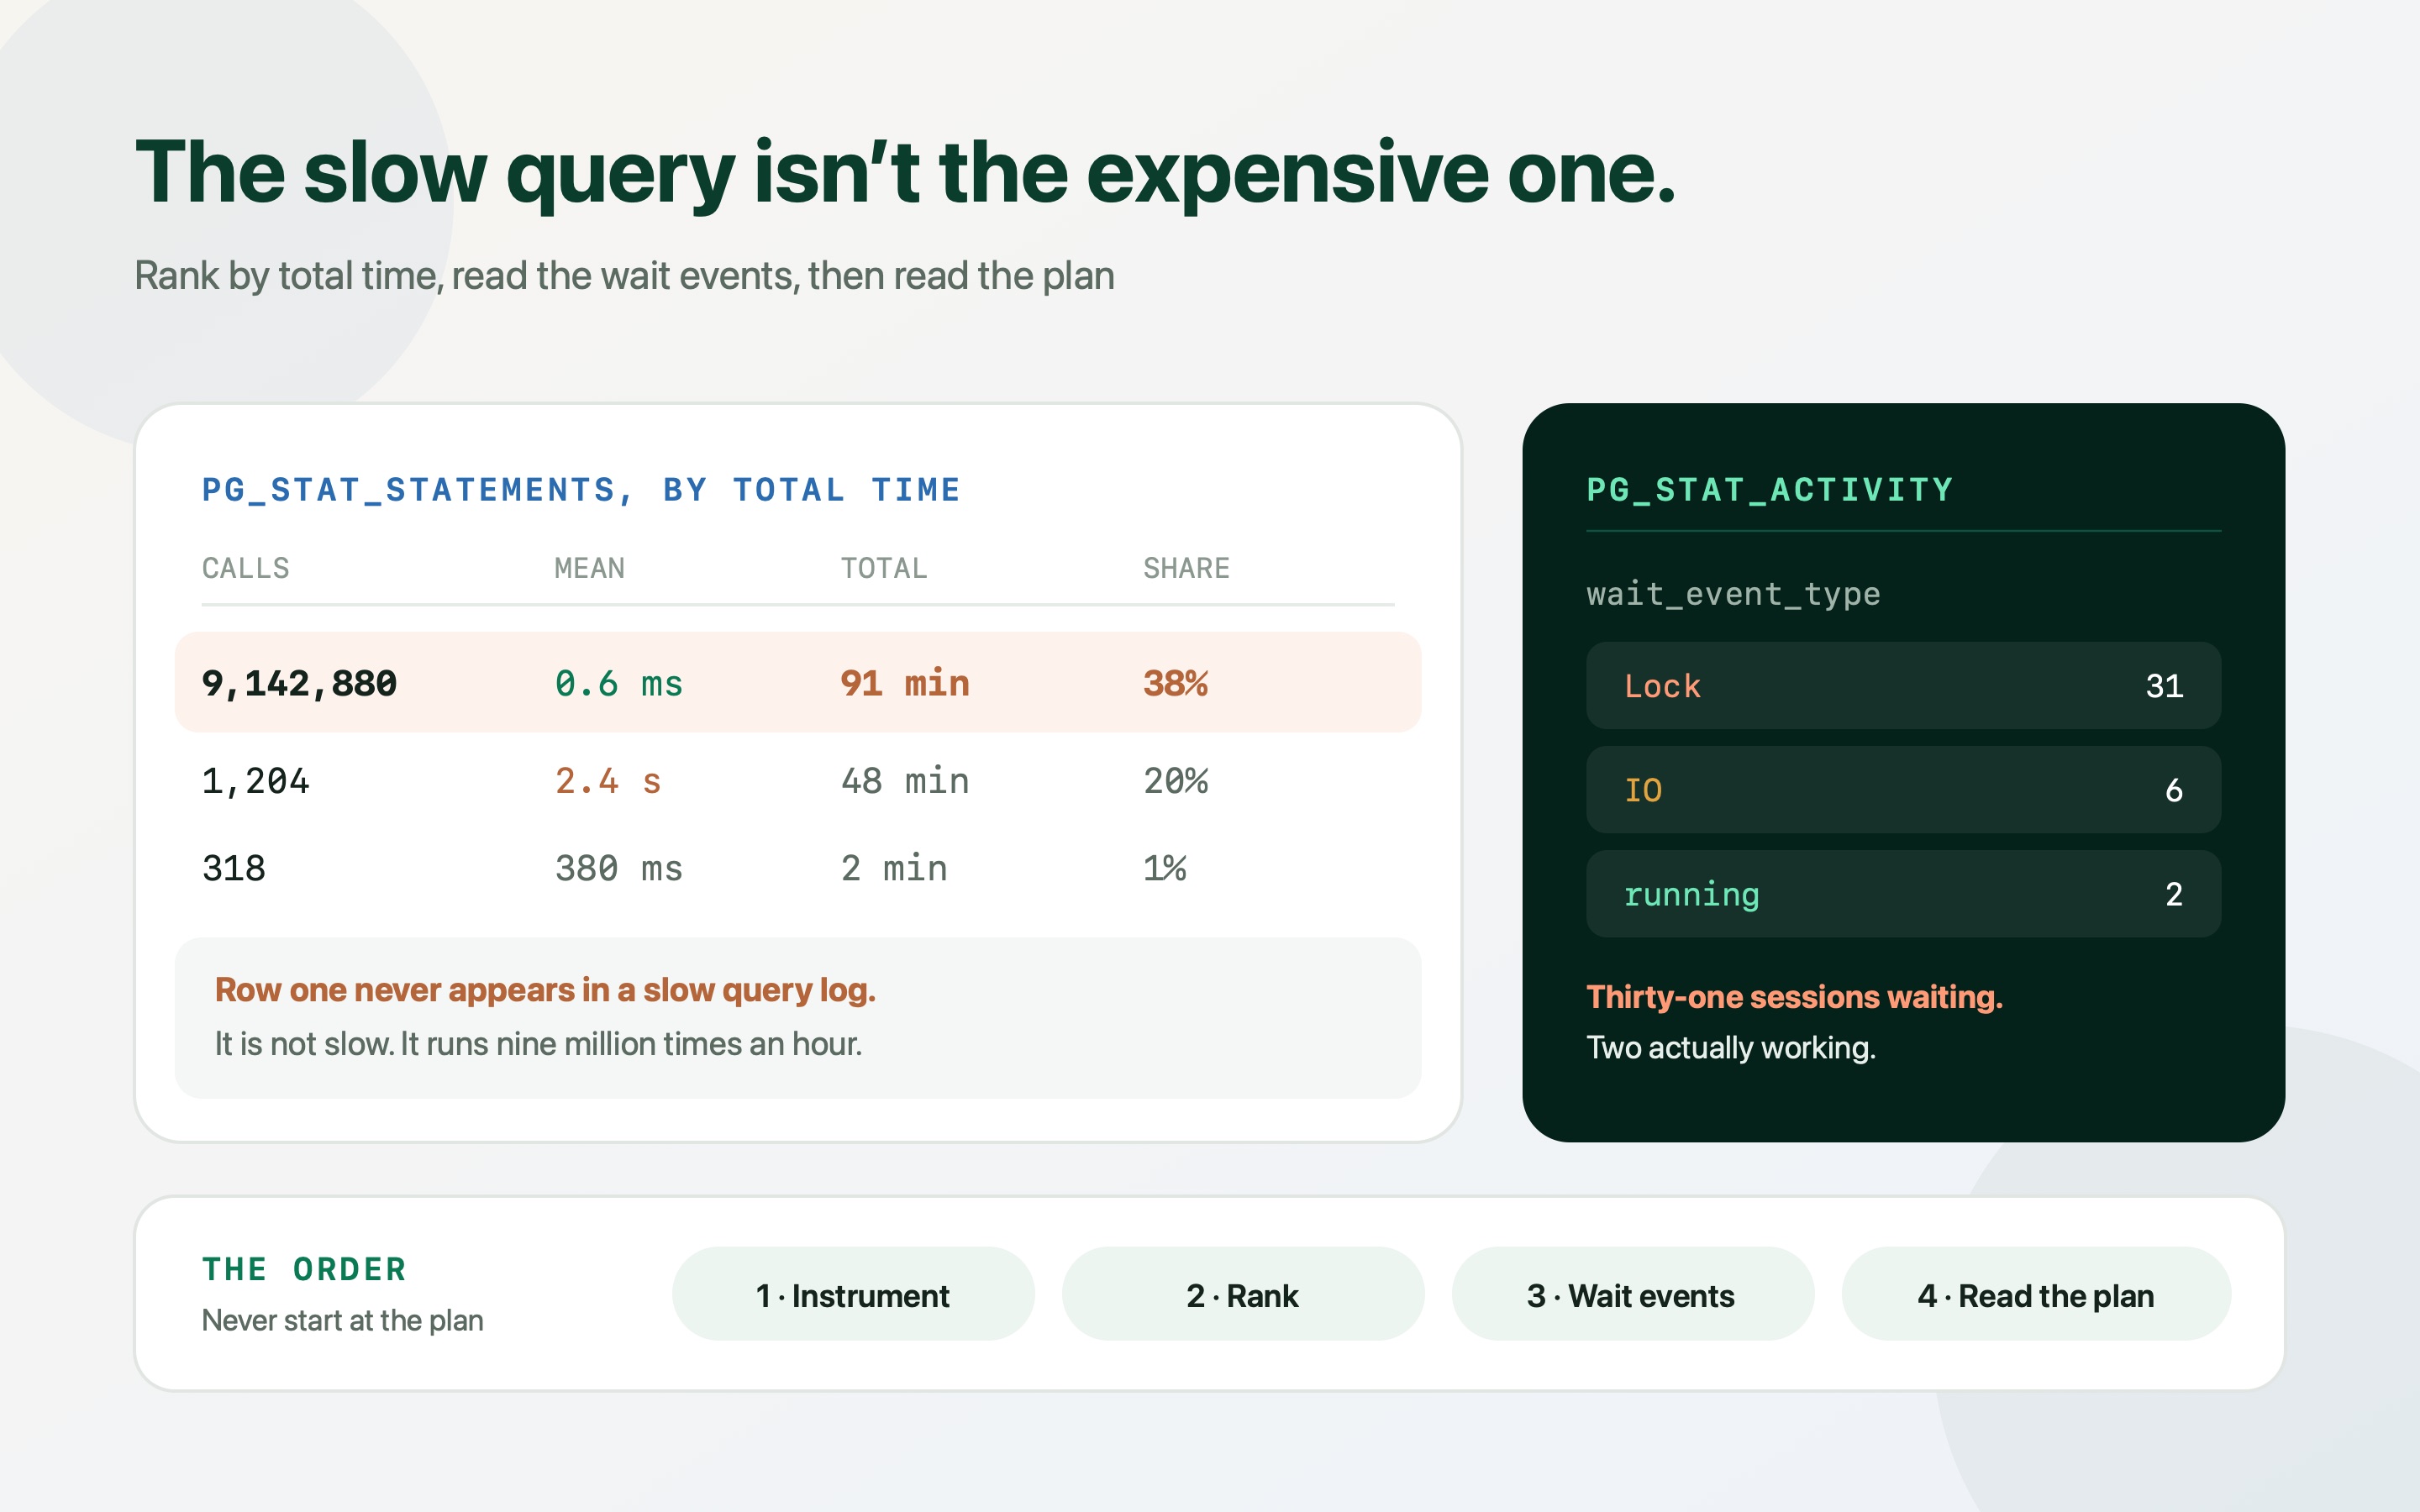
This is the step that reorders most people's intuition. Sort pg_stat_statements by total execution time and the top of the list is frequently a query with a mean of 0.6ms that runs nine million times an hour. It has never appeared in a slow query log and never will, because it is not slow. It is just relentless.
Include rows per call and the cache hit ratio in the same view. A query returning 40,000 rows per call to render a page that shows twenty of them is a different bug from one returning four rows but reading them all from disk. The first is an application fix, the second is memory or indexing.
Read stddev too. A query with a mean of 12ms and a standard deviation of 900ms is not a slow query — it is two different plans, or the same plan sometimes waiting on a lock. That distinction saves you from optimising an execution path that is already fast.
SELECT
  calls,
  round(total_exec_time::numeric)                        AS total_ms,
  round(mean_exec_time::numeric, 2)                      AS mean_ms,
  round(stddev_exec_time::numeric, 2)                    AS stddev_ms,
  round((rows::numeric / NULLIF(calls, 0)), 1)           AS rows_per_call,
  round(100.0 * shared_blks_hit
        / NULLIF(shared_blks_hit + shared_blks_read, 0), 1) AS cache_hit_pct,
  round(100.0 * total_exec_time
        / NULLIF(sum(total_exec_time) OVER (), 0), 1)       AS pct_of_total,
  left(regexp_replace(query, '\s+', ' ', 'g'), 80)        AS query
FROM pg_stat_statements
WHERE calls > 50
ORDER BY total_exec_time DESC
LIMIT 20;

-- How to read the result:
--   high calls, low mean        -> N+1 or a missing cache, fix in the app
--   low calls, high mean        -> a genuine heavy query, read its plan
--   high stddev                 -> two plans, or lock waits, not slowness
--   low cache_hit_pct           -> working set no longer fits in memory
-- rows_per_call in thousands -> you are fetching data nobody rendersAsk the database what it is waiting on right now
Ranking tells you where time went historically. pg_stat_activity tells you where it is going at this moment, and during an active incident it is the fastest route to the answer. The column that matters is wait_event_type: it separates “doing work” from “waiting for a lock” from “waiting for disk” from “waiting for the client”.
Run it while the system is unhappy, a few times, thirty seconds apart. A pattern across samples is evidence; a single sample is an anecdote. If the same wait_event shows up in most samples, you have found the bottleneck without reading a single plan.
pg_blocking_pids() closes the loop on lock waits. It gives you the process that is actually holding the thing everyone else is queued behind, which is almost never the query people were complaining about.
Sessions stuck in 'idle in transaction' are the most common self-inflicted production stall I find. Set idle_in_transaction_session_timeout so the database stops paying for an application bug.
SELECT
  pid,
  now() - query_start          AS running_for,
  state,
  wait_event_type,
  wait_event,
  pg_blocking_pids(pid)        AS blocked_by,
  left(query, 70)              AS query
FROM pg_stat_activity
WHERE state <> 'idle'
  AND pid <> pg_backend_pid()
ORDER BY query_start;

-- Anything in 'idle in transaction' for more than a few seconds is a bug
-- in the application, not the database: it is holding locks and snapshots
-- while doing nothing at all.| wait_event_type | What it means | Where the fix lives |
|---|---|---|
| Lock | Waiting for a row or table lock another transaction holds | Shorten the transaction. Usually an external call or a long-running write sitting inside BEGIN/COMMIT. |
| LWLock | Internal contention, often on buffer or WAL structures | Frequently write amplification: too many indexes, oversized rows, or checkpoint pressure. |
| IO | Reading pages from disk rather than shared buffers | Working set exceeds memory. Shrink the index, shrink the query, or add RAM — in that order. |
| Client: ClientRead | Postgres is waiting for the application to say something | Not a database problem. An open transaction held across application work, or a chatty ORM. |
| IPC | Waiting on another backend, commonly parallel workers | Check parallel query settings before assuming the query itself is slow. |
| (null) | Actually running on CPU | This is the case where the plan is genuinely the problem. Now go read it. |
Now read the plan — on production-shaped data
By this point you know which query matters and whether it is waiting or working. Only now is a plan worth reading, and only with ANALYZE and BUFFERS: without them you get the planner's opinion rather than what actually happened.
Three readings do most of the work. The estimate-versus-actual gap tells you whether the planner had good information. The loops count tells you whether a node ran once or three hundred times. Shared read versus shared hit tells you whether the time went on disk or on work.
A plan from a laptop copy with fifty thousand rows is not evidence about a table with ninety million. If you cannot restore production-shaped data, use the plan auto_explain captured in production instead — that is exactly what it is for.
- Rows off by orders of magnitude: Stale statistics, or a correlation the planner cannot see. Run ANALYZE first; if the columns are dependent (city and postcode, tenant and status), CREATE STATISTICS on the pair.
- A Sort node under a LIMIT: You are sorting a large set to return twenty rows. An index whose column order matches the ORDER BY removes the node entirely.
- Nested Loop with high loops on a big inner set: Usually a missing index on the join key, or a row estimate so low the planner thought the loop would run three times.
EXPLAIN (ANALYZE, BUFFERS, VERBOSE, FORMAT TEXT)
SELECT ...;

-- 1. Estimated vs actual rows
--    (cost=0.00..412.5 rows=1) (actual rows=214839 loops=1)
--    Five orders of magnitude out: the planner chose a strategy for a
--    problem you do not have. Run ANALYZE, then check whether the columns
--    are correlated (CREATE STATISTICS fixes what ANALYZE cannot).

-- 2. loops
--    (actual time=0.031..0.044 rows=1 loops=312)
--    0.044ms looks fast until you multiply by 312. This is an N+1 that
--    the plan is showing you directly.

-- 3. Buffers
--    Buffers: shared hit=412 read=9126
--    'read' is disk. A high read count on a query you run constantly
-- means the index or table no longer stays in cache.The five shapes almost every slow query turns out to be
After enough of these, the diagnoses stop being surprising. Five shapes cover the overwhelming majority of what I find in production Postgres, and each has a distinct signature in the evidence you have already collected.
The value of naming them is speed: once you can match a symptom to a shape, you skip the fortnight of trying things. It also tells you who owns the fix — three of the five are application changes, not database changes.
SELECT
  relname,
  n_live_tup,
  n_dead_tup,
  round(100.0 * n_dead_tup / NULLIF(n_live_tup + n_dead_tup, 0), 1) AS dead_pct,
  last_autovacuum,
  last_autoanalyze,
  seq_scan,
  idx_scan
FROM pg_stat_user_tables
WHERE n_dead_tup > 10000
ORDER BY n_dead_tup DESC
LIMIT 20;

-- dead_pct above ~20% on a hot table is worth acting on.
-- last_autovacuum stuck days in the past on a busy table usually means
-- autovacuum is being starved, or an old open transaction is holding
-- back the horizon. Check that before tuning thresholds:
SELECT pid, state, now() - xact_start AS xact_age, left(query, 60)
FROM pg_stat_activity
WHERE xact_start IS NOT NULL
ORDER BY xact_start
LIMIT 5;| Signature in the evidence | Cause | The fix |
|---|---|---|
| Seq Scan or Sort on a filtered query; estimate close to actual | Index missing, or column order does not match the query | Composite index with equality columns first, then the sort column. CREATE INDEX CONCURRENTLY on live tables. |
| Estimate off by orders of magnitude | Stale or insufficient statistics; correlated columns | ANALYZE, raise default_statistics_target on the column, CREATE STATISTICS for dependent pairs. |
| wait_event_type = Lock; log_lock_waits entries | A transaction holding a row lock across slow work | Move external calls and application logic out of the transaction. Prefer a conditional UPDATE to SELECT FOR UPDATE. |
| Huge calls count, tiny mean, invisible in slow logs | N+1 in the ORM, or a cache that was never added | Batch the fetch, or eager-load the association. Application side, not database side. |
| Gradually worse; high n_dead_tup; low cache hit ratio | Bloat and autovacuum not keeping up | Tune autovacuum per table, reindex concurrently, and check for long-lived transactions holding back the vacuum horizon. |
Prove the fix, then keep the measurement
A fix you cannot demonstrate is a story. Reset pg_stat_statements, run a representative load, capture the numbers, change exactly one thing, and run it again. One change at a time is not pedantry — it is the only way the next investigation starts from knowledge instead of folklore.
Then leave the instrumentation on. The ranking query above, run monthly, is a five-minute habit that catches the query which quietly tripled its call count after a release, long before it becomes an incident.
The queries that hurt you next quarter are already in pg_stat_statements this quarter, several rows below the top. Performance work is much cheaper when it is a review rather than a rescue.
Change one thing between measurements. Two changes and a 40% improvement teach you nothing about which one to do again next time.
-- 1. Baseline: clear the counters, then run real traffic (or a replay)
SELECT pg_stat_statements_reset();

-- 2. ... 30 minutes of representative load ...

-- 3. Snapshot the top offenders into a table you can diff later
CREATE TABLE IF NOT EXISTS perf_baseline AS
SELECT now() AS captured_at, queryid, calls, total_exec_time, mean_exec_time
FROM pg_stat_statements;

-- 4. Apply exactly one change. Repeat steps 1-3.
-- 5. Compare by queryid, not by query text: the text is normalised
--    and will look identical either side of the change.
Frequently asked questions
What is the first thing to check when Postgres is slow in production?
Not a query — the wait events. Sample pg_stat_activity a few times while the system is unhappy and look at wait_event_type. If sessions are waiting on Lock, you have contention; on IO, the working set no longer fits in memory; on nothing at all, the query is genuinely running and its plan is worth reading. That one check tells you which of three very different investigations you are in.
Does pg_stat_statements slow down the database?
Very little. It adds a small fixed cost per query execution and a shared memory allocation sized by pg_stat_statements.max; on typical OLTP workloads the overhead is in the low single digits of percent, and most managed providers enable it by default. auto_explain with log_analyze is the setting that needs care — sample it rather than logging every statement on a busy server.
Why is a query slow in production but fast when I run it manually?
Three usual reasons. Your manual run has warm cache and no competition for locks or connections. Your parameters differ, so the planner picks a different plan — a prepared statement may also have switched to a generic plan after five executions. And production runs it with concurrency, which is where lock waits and pool exhaustion appear. auto_explain captures the plan that actually ran in production, which settles the argument.
How do I find an N+1 query in Postgres?
Sort pg_stat_statements by total_exec_time, not mean_exec_time. An N+1 is individually fast, so it never enters a slow query log; it shows up as an unremarkable mean with an enormous call count and a large share of total time. In EXPLAIN ANALYZE output the same problem appears as a node with a high loops value.
What does 'idle in transaction' mean and why does it matter?
The session has an open transaction but is not running a statement — the application opened BEGIN and then went off to do other work. It holds any locks already taken and blocks the vacuum horizon, so dead rows accumulate across the whole database. Set idle_in_transaction_session_timeout to bound the damage, then fix the code path that leaves transactions open.
Should I add an index, tune autovacuum, or upgrade the instance?
In that order, and only on evidence. An index is a migration with no monthly cost, so if a plan shows a sequential scan or a sort on a filtered query, start there. Autovacuum tuning is the answer when performance degrades gradually and dead tuple counts are high. A bigger instance is honest only when CPU is genuinely saturated and the plans are already good — it will not fix a lock that serialises every request behind one row.