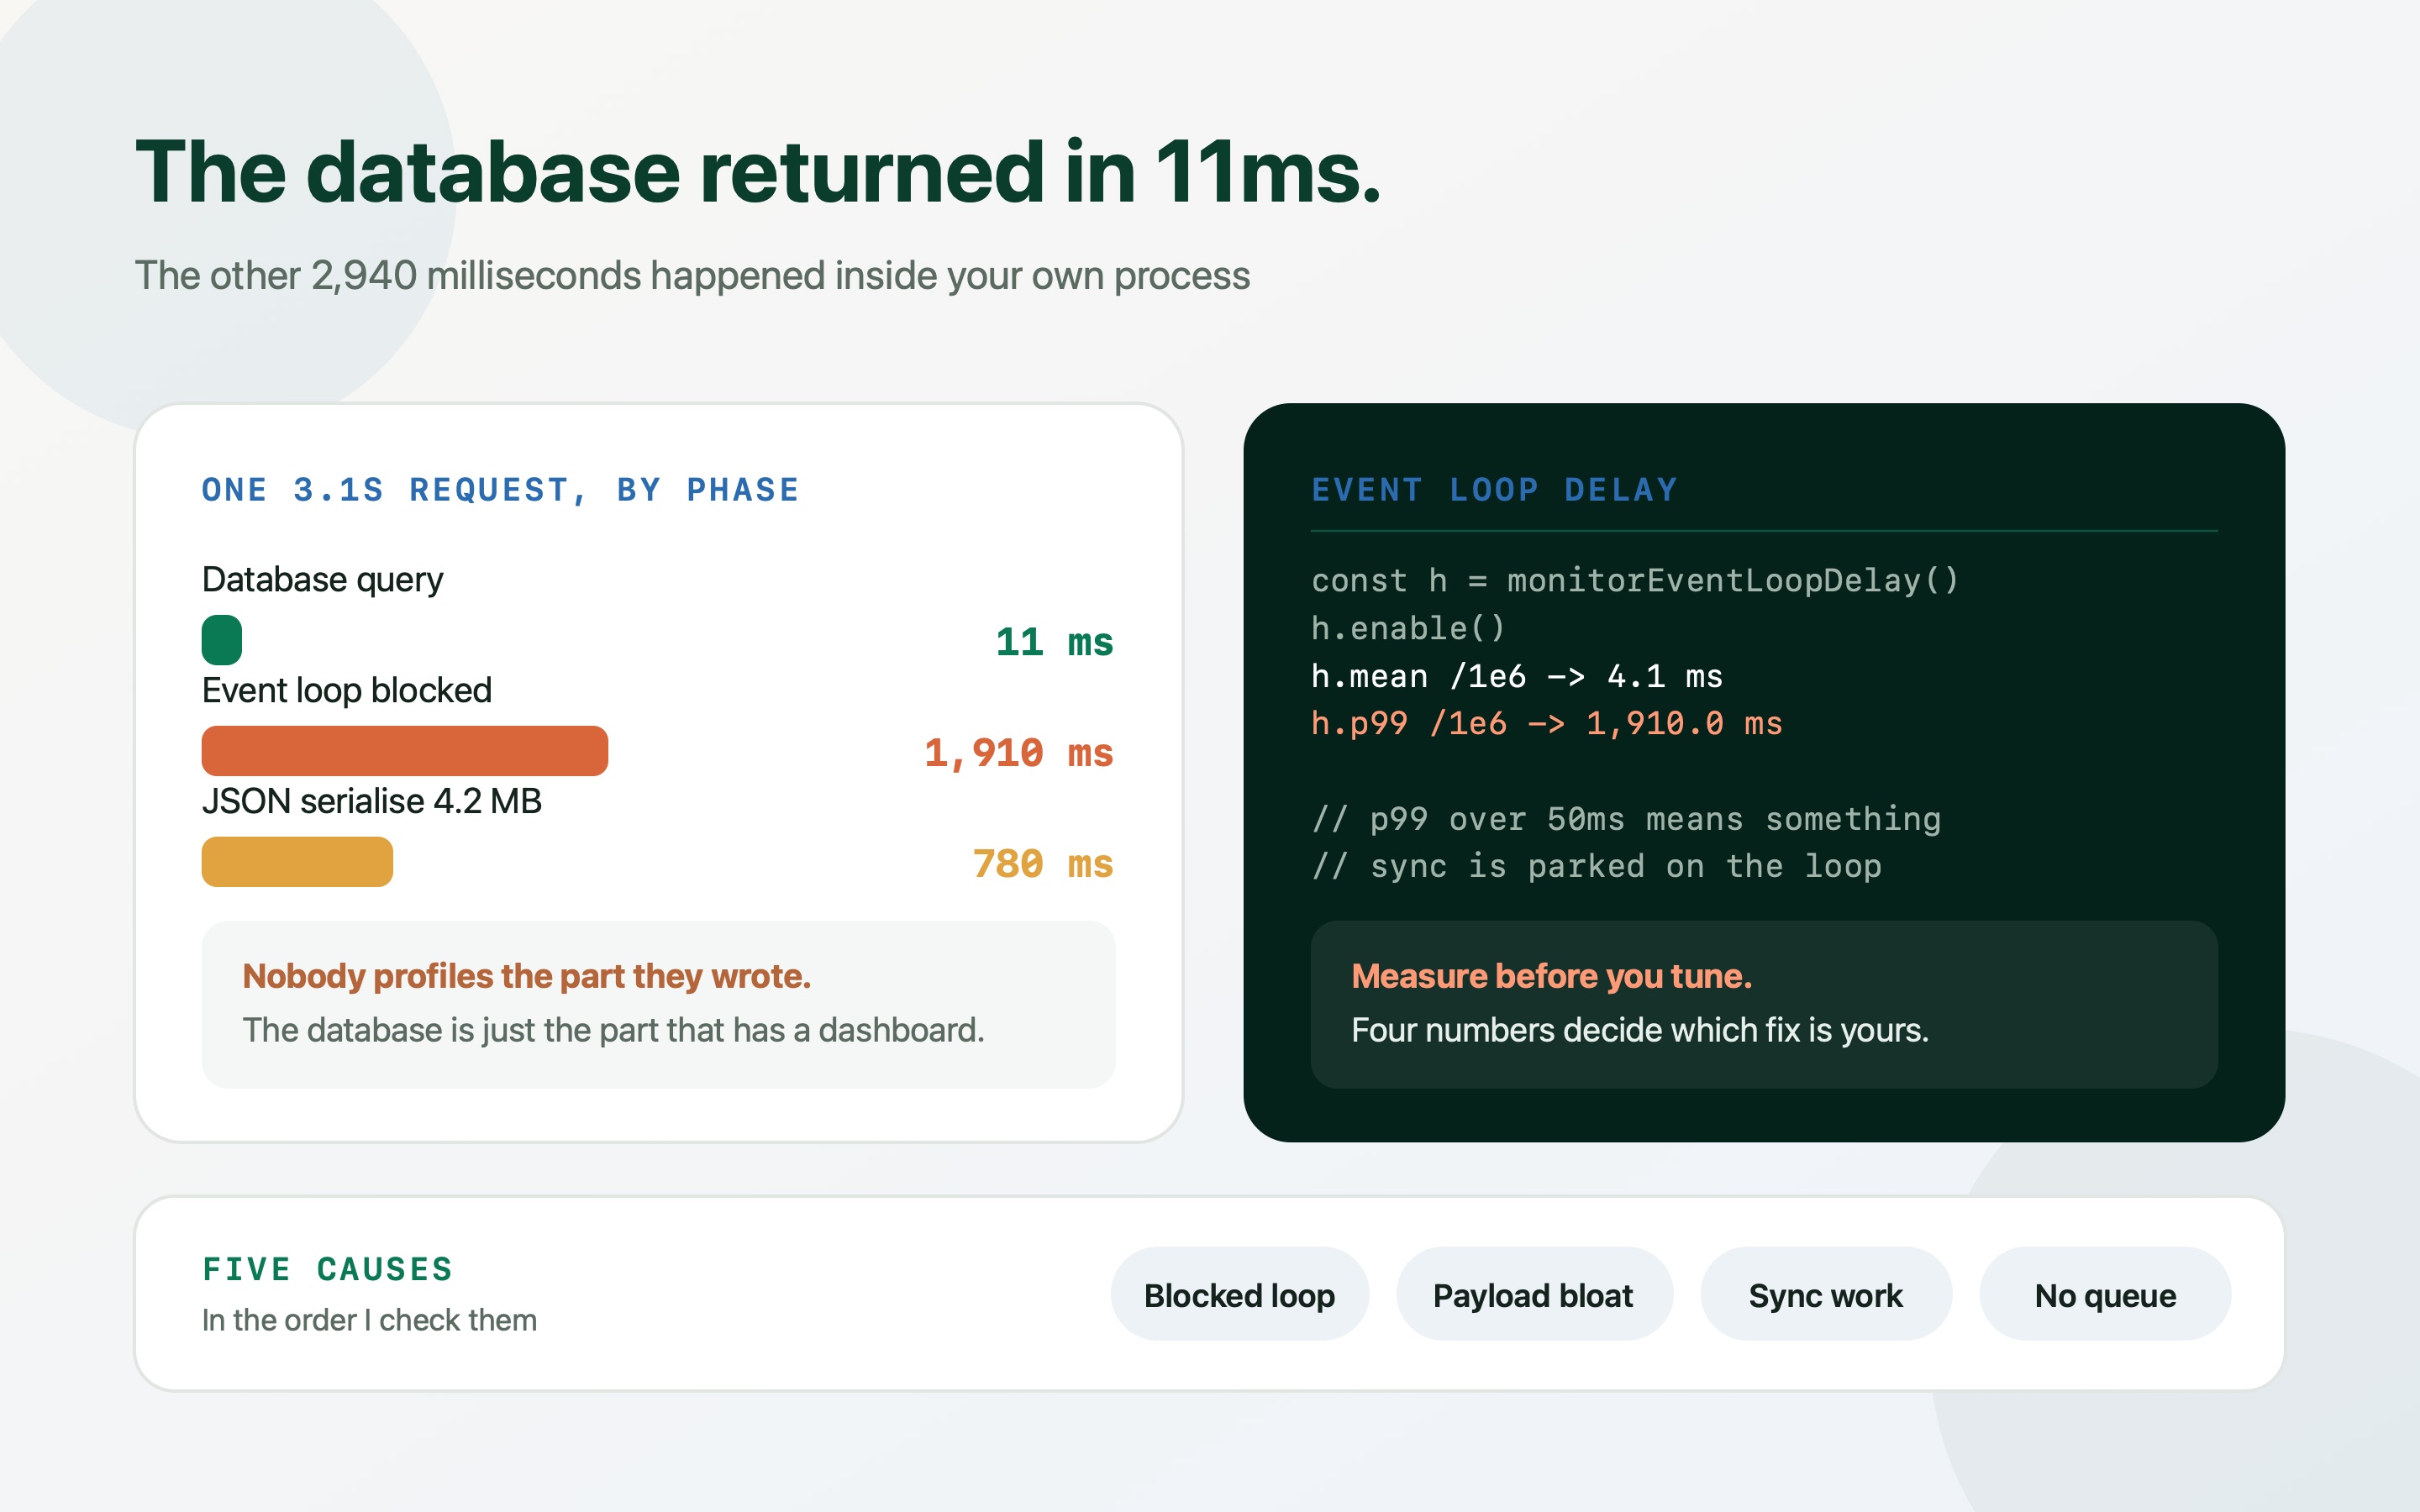
The database answered in eleven milliseconds. Everyone spent a week on the database anyway, because it is the only part of the stack with a graph on the wall.
A dashboard that takes three seconds is one of the most common things I get called about, and it arrives with a theory attached: the database needs an index, or a bigger instance, or Redis in front of it.
Sometimes that is true. More often the slow query log is empty, the database is at nine percent CPU, and every query the endpoint runs comes back in single-digit milliseconds. The time is going somewhere else — into the process you wrote, where nobody is looking.
Five causes account for almost all of it. They are ordered below by how often I find them, and each one has a measurement that takes minutes. Do the measurement first: four of the five are invisible to the tools most teams already have.
Split the request into four buckets before guessing
A request spends its life in exactly four places: waiting on I/O you asked for, running your own CPU work, turning the result into bytes, and doing things that did not need to happen before the response. Every cause below sits in one of those buckets, and knowing the bucket eliminates three quarters of the search space.
The cheapest way to see the split is the Server-Timing header. It costs a handful of lines, it shows up in the browser's network panel next to the request, and it survives into production where your laptop profiler cannot follow. If you already run an APM, the same breakdown is in the span waterfall — but read the gaps between spans, not the spans themselves. The gaps are your own code.
Write the four numbers down before you touch anything. A change that improves a bucket holding four percent of the time is a change you will not be able to see.
If the four numbers do not add up to the total request time, the difference is queueing — your process was busy with somebody else's request. That is cause one, and it is the most common of the lot.
// express, but the idea ports anywhere
app.use((req, res, next) => {
  const marks = {}
  res.locals.time = async (name, fn) => {
    const t = process.hrtime.bigint()
    try {
      return await fn()
    } finally {
      marks[name] = Number(process.hrtime.bigint() - t) / 1e6
    }
  }
  res.on('finish', () => {})
  const send = res.json.bind(res)
  res.json = (body) => {
    const t = process.hrtime.bigint()
    const payload = JSON.stringify(body)
    marks.serialise = Number(process.hrtime.bigint() - t) / 1e6
    marks.bytes = Buffer.byteLength(payload)
    res.setHeader(
      'Server-Timing',
      Object.entries(marks).map(([k, v]) => k + ';dur=' + v.toFixed(1)).join(', '),
    )
    res.type('application/json').send(payload)
  }
  next()
})

// In the handler:
//   const rows = await res.locals.time('db', () => repo.invoices(userId))
//   const view = await res.locals.time('map', () => rows.map(toView))
//
// Server-Timing: db;dur=11.4, map;dur=1910.2, serialise;dur=780.6, bytes;dur=4211992
// One header. The argument about whose fault it is ends here.Cause 1 — the event loop is blocked, so every request waits
Node runs your JavaScript on one thread. Anything synchronous that takes real time — parsing a large JSON body, hashing a password with the sync API, resizing an image, a regex that backtracks, sorting fifty thousand objects — stops every other request in the process for exactly as long as it runs. The endpoint doing the work looks slow, but so does the health check, and that is the tell.
The symptom is a latency graph where slow requests cluster rather than scatter, and where p99 is thirty times p50 while CPU sits at a modest number. The measurement is `monitorEventLoopDelay`, which costs nothing and answers the question outright: if the loop's p99 delay is over about fifty milliseconds, something synchronous is parked on it.
Python has the same problem wearing different clothes. A blocking call inside an `async def` handler — a synchronous database driver, `requests`, `time.sleep`, a CPU-bound loop — holds the event loop exactly the way it does in Node. Ironically FastAPI's plain `def` handlers are safer, because they run in a threadpool. Turn on asyncio's debug mode and it will name the callback that overran.
- Move CPU work off the request thread: worker_threads or a child process in Node, asyncio.to_thread or a Celery task in Python. If it takes more than about ten milliseconds and does not need to finish before the response, it belongs on a queue.
- Never use the sync crypto or filesystem APIs in a handler: pbkdf2Sync, scryptSync, readFileSync, execSync. Each one blocks the loop for its entire duration, and password hashing is designed to be slow on purpose.
- Watch out for accidental O(n²): A nested find() over two arrays of five thousand items is twenty-five million comparisons on the request thread. Build a Map once instead.
- Check your worker count: One Node process uses one core. Run one per core behind the load balancer (or the cluster module) — and in Python, size gunicorn workers to the cores you actually have, not the default.
const { monitorEventLoopDelay } = require('node:perf_hooks')

const h = monitorEventLoopDelay({ resolution: 10 })
h.enable()

setInterval(() => {
  console.log({
    mean_ms: (h.mean / 1e6).toFixed(1),
    p99_ms: (h.percentile(99) / 1e6).toFixed(1),
    max_ms: (h.max / 1e6).toFixed(1),
  })
  h.reset()
}, 10_000).unref()

// mean 4.1 / p99 1910.0  -> something synchronous, and it is large
// mean 0.8 / p99 12.0    -> the loop is fine, look elsewhere

// Then find it: run with --cpu-prof and read the flame graph, or
// bisect by wrapping suspects:
// const t = Date.now(); doSuspectThing(); logIfOver(50, Date.now() - t)# Debug mode names any callback that overruns slow_callback_duration
import asyncio, logging
logging.basicConfig(level=logging.WARNING)
loop = asyncio.get_event_loop()
loop.set_debug(True)
loop.slow_callback_duration = 0.1 # warn on anything over 100ms
# WARNING: Executing <Handle Server._accept ...> took 1.910 seconds
# The usual culprit, and the fix:
@app.get("/report")
async def report():
# rows = db.execute(...) # sync driver, blocks the whole loop
rows = await database.fetch_all(...) # async driver
# png = render_chart(rows) # CPU-bound, blocks the whole loop
png = await asyncio.to_thread(render_chart, rows)
return {"rows": rows, "chart": png}
# In production, py-spy reads a running process without restarting it:
# py-spy top --pid 1
# py-spy dump --pid 1 # what every thread is doing, right nowCause 2 — you serialise four megabytes to render twenty rows
`JSON.stringify` is synchronous CPU work, and its cost scales with the size of the object graph you hand it. A response carrying every column of every row, plus nested relations nobody renders, is a payload that costs you twice: once to serialise on the server, once to parse in the browser, plus the transfer in between.
The pattern that produces it is almost always an ORM returning whole entities straight to the view layer. Nobody chose to send 4.2MB; they chose `SELECT *` and a `toJSON`, and the payload grew as the schema did.
Two fixes, both boring. Select only the columns the screen uses, and paginate anything unbounded. A list endpoint with no limit is a time bomb whose timer is your growth rate. Once the payload is small, enable compression — but not before, because gzipping four megabytes is more CPU on the same blocked thread.
Log response bytes next to response time on every endpoint. It is one line of middleware and it makes payload bloat visible the week it appears, rather than the quarter it becomes an incident.
| Payload | Serialise (CPU) | What usually causes it |
|---|---|---|
| 18 KB, 20 rows, 6 fields each | Under 1 ms | An explicitly selected view model. This is the target. |
| 410 KB, 20 rows, full entities | ~20 ms | Returning ORM models directly, with every column and timestamp. |
| 4.2 MB, 16,000 rows | ~780 ms | An unpaginated list endpoint, plus eager-loaded relations the UI never reads. |
| 4.2 MB, gzipped on the fly | ~780 ms + ~120 ms | Compression on a payload that should not exist — same thread, more work. |
Cause 3 — work that has no business happening before the response
Open a slow handler and read it as a list of side effects. Sending the confirmation email, generating the PDF, pushing an analytics event, syncing to the CRM, warming a cache, writing an audit record to a second database — each one is defensible, and together they are two seconds the user waits for things that do not affect what they see.
The rule I apply: if the user's next screen does not depend on it, it does not belong in the request. Push it to a queue and return. This is the single largest latency win available in most applications, and it also makes the endpoint more reliable, because a vendor being down stops meaning your checkout is down.
Where a call genuinely must happen inline, two disciplines apply. Run independent calls concurrently rather than in sequence — three 300ms calls should cost 300ms, not 900ms. And put an explicit timeout on every outbound request. Without one you have inherited your slowest vendor's p99 as your own, and most HTTP clients default to no timeout at all.
- Every outbound call gets a timeout: Node's fetch and axios both default to waiting forever. One hung vendor connection can hold a worker until the load balancer gives up.
- Retries need a budget: Three retries with a one-second backoff on a 500ms call is a four-second worst case you have written into the request path. Retry in the worker, not in the handler.
- A queue needs a dead letter: Moving work out of the request only helps if somebody notices when it fails. Dead-letter queue, alert, and a retry policy on day one.
// Before: 2.4s, of which 2.1s is not the user's problem
async function createOrder(req, res) {
  const order = await db.orders.create(req.body)   //  40ms
  await mailer.sendConfirmation(order)             // 820ms, vendor
  await pdf.generateInvoice(order)                 // 640ms, CPU
  await crm.upsertContact(order.customer)          // 410ms, vendor
  await analytics.track('order_created', order)    // 190ms, vendor
  res.json(order)
}

// After: 40ms, and the vendors can be down without taking checkout with them
async function createOrder(req, res) {
  const order = await db.orders.create(req.body)
  await queue.addBulk([
    { name: 'order.confirmation', data: { orderId: order.id } },
    { name: 'order.invoice',      data: { orderId: order.id } },
    { name: 'crm.upsert',         data: { customerId: order.customer.id } },
    { name: 'analytics.track',    data: { event: 'order_created', id: order.id } },
  ])
  res.json(order)
}

// When a call really must be inline: concurrent, and always timed out.
const [rates, stock] = await Promise.all([
  fetch(ratesUrl, { signal: AbortSignal.timeout(800) }).then((r) => r.json()),
  fetch(stockUrl, { signal: AbortSignal.timeout(800) }).then((r) => r.json()),
])Cause 4 — the N+1 that never appears in any log
If the four buckets show a large `db` number made of a very large number of small queries, you have an N+1: an ORM loop issuing one query per row instead of one query for all rows. Each query is fast, so nothing crosses a slow-query threshold, and the endpoint is inexplicably slow while every query it runs is inexplicably quick.
The fastest confirmation is a query counter. Count the queries a single request issues and assert on it in a test; anything that scales with row count is the bug. Most APMs will show it as a wall of identical spans, which is the same evidence in prettier form.
I have written this one up separately, with a real endpoint that issued thirty-two thousand queries and how it got caught, so I will not repeat the detail here.
A query counter in your test suite is the cheapest permanent defence there is: assert that the list endpoint issues a fixed number of queries, and the next lazy-loading regression fails CI instead of production.
Cause 5 — the tax you pay on every single request
The last category is the one nobody profiles because it is not in any handler: middleware. It runs on every request, so a fifteen-millisecond cost there is worth more than a hundred-millisecond cost on one endpoint.
The recurring offenders are consistent. Logging that serialises whole request and response bodies. Auth middleware that makes a network call to verify a token on every request instead of verifying the signature locally and caching the key set. ORM hydration that instantiates model objects for rows you are about to discard. A CORS configuration that forces a preflight on every call. Session middleware hitting Redis before deciding the route does not need a session.
Measure it by timing the middleware chain separately from the handler. If the gap between request start and handler start is not close to zero, the tax is worth an hour of your time.
| Middleware | What it costs | The fix |
|---|---|---|
| Body logging | Serialising every request and response, on the request thread | Log metadata, not bodies. Sample full payloads at 1% if you need them. |
| Token introspection per request | A full network round trip before your code runs | Verify the JWT signature locally; cache the JWKS. Introspect only for revocation-sensitive routes. |
| Session lookup on public routes | A Redis round trip on requests that need no session | Mount session middleware on the routes that use it, not globally. |
| ORM hydration of discarded rows | Object construction for data you filter away in code | Filter in SQL, and select into a plain object for read-only paths. |
| Compression on tiny responses | CPU to shrink 400 bytes into 380 | Set a threshold — most compression middleware supports one and defaults it too low. |
Prove it with a load test, one change at a time
Every fix above is easy to believe in and easy to be wrong about. Put the endpoint under the concurrency that actually hurts, record p50, p95 and p99, change one thing, run it again.
Concurrency matters more than request count here, because the whole point of cause one is that requests interfere with each other. A single-threaded benchmark will show you nothing about a blocked event loop; fifty concurrent clients will show you everything.
The numbers below are from a representative run. Yours will differ — what carries over is the shape: the largest win is usually removing work, not speeding it up.
# 50 concurrent clients, 60 seconds, latency percentiles
npx autocannon -c 50 -d 60 -l https://staging.example.com/api/dashboard

# or, if you prefer k6
k6 run --vus 50 --duration 60s load/dashboard.js

# Record for every run, and change exactly one thing between them:
# p50, p95, p99, requests/sec, event loop p99 delay, response bytes| Change | p95 | Why it moved |
|---|---|---|
| Baseline, 50 concurrent | 3.1 s | Image resize on the request thread; 4.2MB payload; four vendor calls inline. |
| Image resize moved to a worker | 1.2 s | The event loop stops stalling, so unrelated requests stop queueing behind it. |
| Payload cut to the fields rendered | 640 ms | Serialisation drops from ~780ms to under 10ms, and transfer shrinks with it. |
| Email, PDF, CRM, analytics queued | 180 ms | Two seconds of vendor latency leaves the request path entirely. |
| Body logging sampled, JWT verified locally | 96 ms | Per-request tax removed from every endpoint, not just this one. |
Frequently asked questions
My API is slow but the database is fast. Where do I look first?
Split the request into four buckets: I/O you requested, your own CPU work, serialisation, and side effects that did not need to be inline. A Server-Timing header gives you all four in about fifteen lines of middleware. In Node, check event loop delay at the same time — if p99 delay is over roughly 50ms, requests are queueing behind synchronous work and no individual measurement will show it.
How do I know if my Node event loop is blocked?
Use monitorEventLoopDelay from node:perf_hooks and log mean and p99 every ten seconds. A healthy loop sits under a few milliseconds. A p99 in the hundreds means something synchronous — JSON parsing of large bodies, sync crypto, image processing, a runaway regex — is holding the only thread you have. Confirm with --cpu-prof and read the flame graph.
Does the same problem exist in Python?
Yes, with a twist. A blocking call inside an async def handler stalls the asyncio loop exactly as it does in Node, so a synchronous database driver or a requests call is the classic cause. FastAPI's plain def handlers are actually safer because they run in a threadpool. Set loop.slow_callback_duration and enable debug mode to catch overruns, and use py-spy to inspect a running process without restarting it.
Should I add caching to fix a slow endpoint?
Only after you know which bucket the time is in. Caching helps when the work is expensive and repeated with the same inputs. It does nothing for a blocked event loop, a four-megabyte payload or a vendor call in the request path — and it adds an invalidation problem you now own forever. Remove the work first; cache what remains.
How much of my API latency should be database time?
For a typical CRUD endpoint, most of it. If the database accounts for under a third of a slow response, the interesting work is happening in your process, not in the database. That ratio is the single most useful number to put on a dashboard, because it tells you which team's afternoon the next performance problem belongs to.
Is it worth moving from Node or Python to a faster language?
Almost never at this stage, and the causes above are why. Blocked loops, oversized payloads, inline vendor calls and N+1 queries all survive a rewrite unchanged — you would carry the same bugs into a language where they are harder to debug. Fix the five causes first; runtime speed becomes the bottleneck far later than people expect.