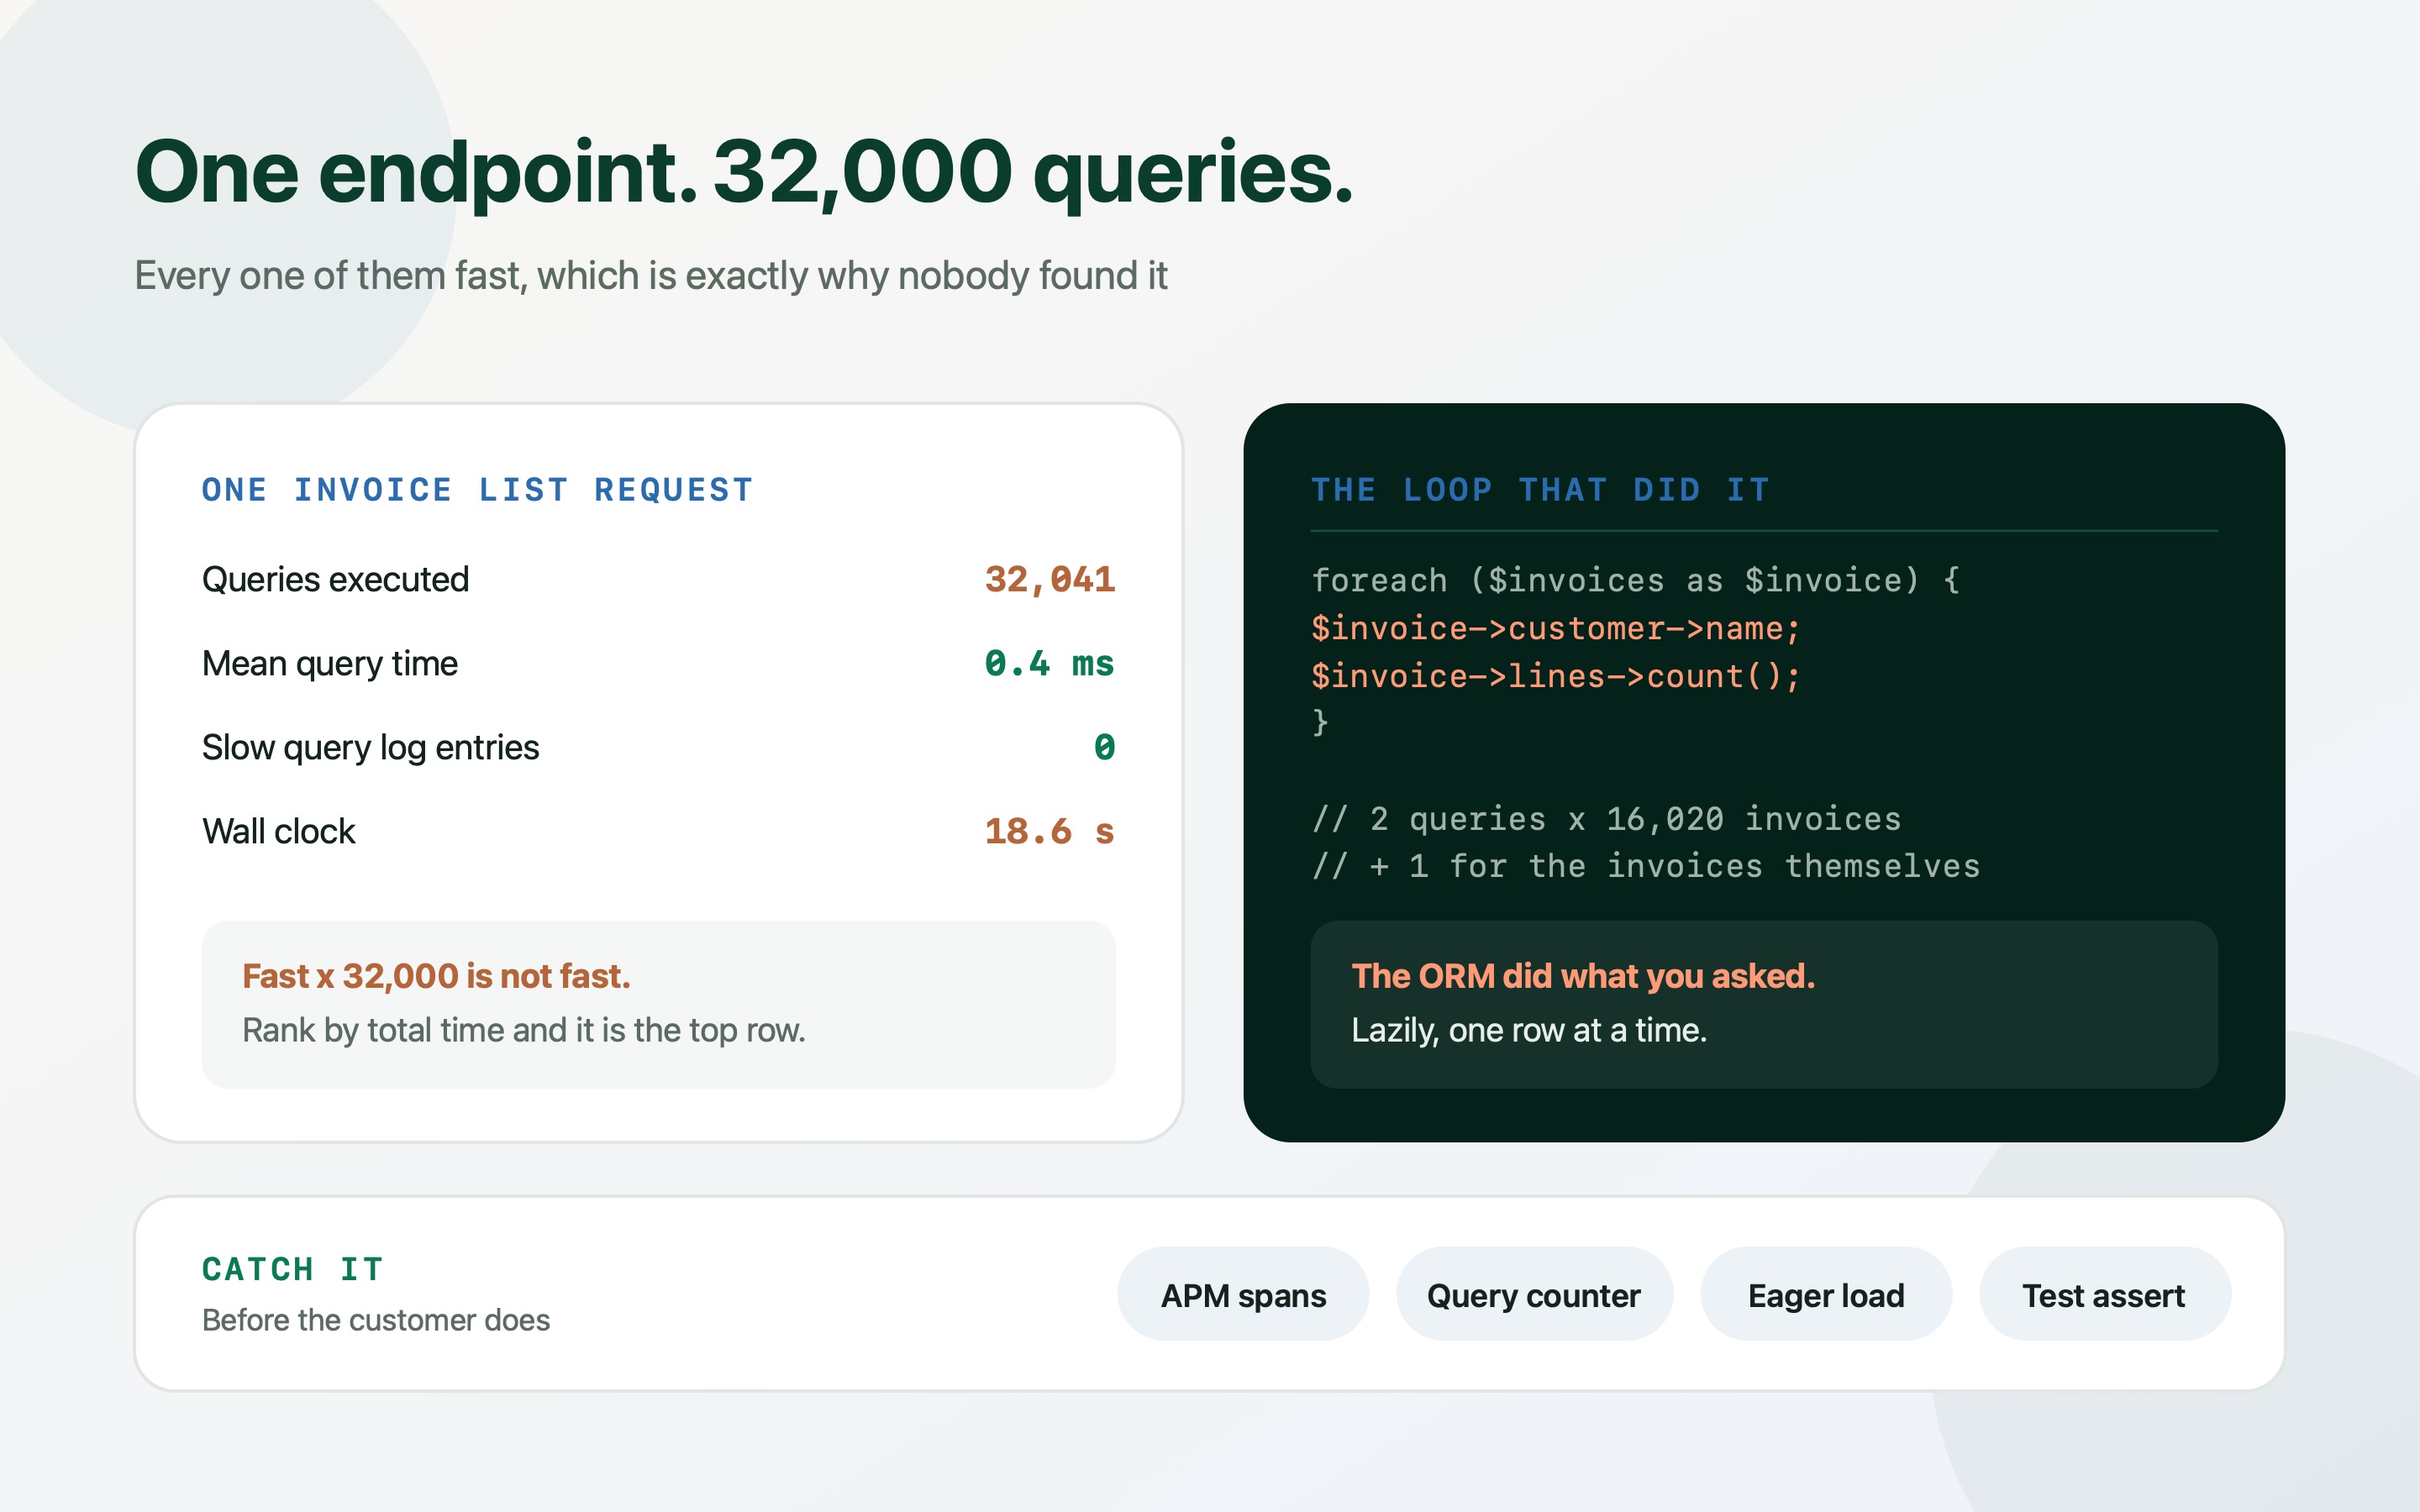
Thirty-two thousand queries, each one averaging four tenths of a millisecond. Not one of them was slow, which is exactly why the problem survived a year of people looking for a slow query.
The complaint was specific in the way useful complaints are: the invoice list is fine for most customers and unusable for the three biggest ones. Those three happened to be the reference accounts.
Every obvious check came back clean. The slow query log was empty. Database CPU was unremarkable. The indexes were the right indexes. The endpoint still took the better part of twenty seconds for a tenant with sixteen thousand invoices, and about two hundred milliseconds for a tenant with eighty.
That ratio is the fingerprint. Latency scaling linearly with row count, while every individual query stays fast, is an N+1 — and it is the most durable performance bug in modern applications precisely because it is invisible to every tool that looks for slowness.
What the request actually did
The first real evidence came from counting rather than timing. Instrumenting the endpoint to count queries per request turned a vague complaint into a number: 32,041 queries to render one page of invoices.
An APM trace shows the same thing as a wall of identical spans, thousands of them, each a sliver. If you have DataDog, New Relic, Sentry performance or equivalent, the N+1 signature is unmistakable once you know to look for it: one parent span, thousands of children with the same query shape, none individually notable.
The arithmetic told the rest of the story immediately. Sixteen thousand and twenty invoices, two extra queries each, plus one for the list itself. Nobody wrote thirty-two thousand queries. Somebody wrote a loop.
Latency that scales with row count while query time stays flat is an N+1 until proven otherwise. No amount of indexing will change it, because the queries are already using indexes perfectly.
| Measure | Large tenant | Typical tenant |
|---|---|---|
| Invoices returned | 16,020 | 80 |
| Queries executed | 32,041 | 161 |
| Mean query time | 0.4 ms | 0.4 ms |
| Entries in the slow query log | 0 | 0 |
| Wall clock | 18.6 s | 210 ms |
The two lines that did it
The handler read the way most handlers read. Fetch the invoices, map them into a view model, return. The view model needed the customer's name and the number of line items — and both were accessed through relations that had not been loaded.
Lazy loading is a feature. The ORM sees an unloaded relation, quietly issues a query to get it, and returns the value, so the code reads as if the data were simply there. Inside a loop, that politeness becomes one query per row per relation.
The code below is Laravel's Eloquent because that is what this application used, but the shape is identical in Django, Rails, Prisma, TypeORM and Sequelize. The framework is not the problem; the loop is.
$invoices = Invoice::where('tenant_id', $tenantId)
    ->orderByDesc('issued_at')
    ->get();                            // 1 query

return $invoices->map(fn (Invoice $invoice) => [
    'id'        => $invoice->id,
    'number'    => $invoice->number,
    'total'     => $invoice->total_cents,
    'customer'  => $invoice->customer->name,   // +1 query, every row
    'lineCount' => $invoice->lines->count(),   // +1 query, every row
]);

// 1 + (16,020 x 2) = 32,041 queries.
// Every one of them indexed, fast, and invisible to the slow query log.$invoices = Invoice::where('tenant_id', $tenantId)
->with('customer:id,name') // 1 extra query for all customers
->withCount('lines') // counted in the main query
->orderByDesc('issued_at')
->paginate(50); // and stop returning 16,020 rows
return $invoices->through(fn (Invoice $invoice) => [
'id' => $invoice->id,
'number' => $invoice->number,
'total' => $invoice->total_cents,
'customer' => $invoice->customer->name, // already loaded
'lineCount' => $invoice->lines_count, // already counted
]);
// 3 queries. 240ms. Same screen.Why it hid for a year
Four things conspired, and they are the same four every time.
The queries were fast, so the slow query log — threshold one second — never saw them. Average response time looked fine, because most tenants are small and averages are generous to tails. Staging had a few hundred rows, so the loop cost four milliseconds there. And the endpoint had not changed; the data had.
That last point matters for how you think about prevention. An N+1 is not introduced by the release that makes it slow. It is introduced quietly, correct and fast, and then a customer grows into it months later. The code review that would have caught it happened long before anyone had a reason to look.
- Slow query logs are the wrong instrument: They rank by per-call duration. An N+1 is defined by being individually fast. It will never appear there, no matter how low you set the threshold.
- Averages hide it: If ninety percent of tenants are small, the mean stays healthy while your largest accounts — usually your most valuable — get the worst experience.
- Staging data hides it: A loop over 80 rows is imperceptible. The bug is a function of production row counts, so it only exists where you are not looking.
Finding yours, with or without an APM
If you have an APM, sort endpoints by database call count rather than by duration and read the top of the list. It takes about a minute and it is the highest-yield minute available in most applications.
Without one, `pg_stat_statements` gets you there. Rank by total execution time rather than mean, and the N+1 is the row with an unremarkable average and an enormous call count. The query text will be a single-row lookup by primary key — which is the tell, because nobody writes that query deliberately thirty thousand times.
The third option, and the one I reach for first in development, is simply to count. Most frameworks expose a query event; counting queries per request and logging anything over a threshold finds every N+1 in an application within a day of normal use.
SELECT
  calls,
  round(mean_exec_time::numeric, 2)  AS mean_ms,
  round(total_exec_time::numeric)    AS total_ms,
  left(regexp_replace(query, '\s+', ' ', 'g'), 60) AS query
FROM pg_stat_statements
ORDER BY total_exec_time DESC
LIMIT 5;

--  calls   | mean_ms | total_ms |                query
-- ---------+---------+----------+----------------------------------------
--  4128442 |    0.40 |  1651376 | SELECT * FROM customers WHERE id = $1
--  4128442 |    0.38 |  1568809 | SELECT count(*) FROM invoice_lines ...
--     1204 |  240.11 |   289092 | SELECT * FROM invoices WHERE tenant ...
--
-- Rows one and two are the N+1. Row three is the query people were tuning.// Prisma, but every ORM exposes an equivalent hook
let count = 0
prisma.$on('query', () => { count += 1 })
app.use((req, res, next) => {
const start = count
res.on('finish', () => {
const used = count - start
if (used > 25) {
logger.warn({ path: req.path, queries: used }, 'possible N+1')
}
})
next()
})
// Laravel: DB::listen(fn () => $count++); plus Model::preventLazyLoading()
// Django: len(connection.queries) with DEBUG, or the nplusone package
// Rails: ActiveSupport::Notifications 'sql.active_record', or bulletThe three fixes, in order of effort
Eager loading is the first and covers most cases. Tell the ORM which relations you need and it fetches them in one additional query per relation, regardless of row count. In Eloquent that is `with()`, in Django `select_related` and `prefetch_related`, in Prisma `include` or `select`, in Rails `includes`. Two minutes of work, ninety percent of the wins.
Aggregates deserve their own treatment. Counting related rows by loading them and calling `count()` is the most expensive possible way to get a number. Use the ORM's counting helper — `withCount`, `annotate(Count(...))`, `_count` — so the database returns the number instead of the rows.
Batching is the third, for cases where the data comes from several sources or the shape resists eager loading. A dataloader collects the keys requested during a tick and issues one query for all of them; it is the standard answer in GraphQL resolvers, and it works just as well outside them. And in every case, pagination belongs on any list endpoint that can grow — without it, the fix only moves the cliff further out.
| Situation | Fix | Cost |
|---|---|---|
| A relation accessed in a loop | Eager load it (with / includes / select_related) | One line. Start here. |
| Counting related rows | withCount / annotate / _count — count in SQL | One line, and usually a bigger win than eager loading. |
| Fields from several services or tables | Batch the keys and resolve them in one round trip (dataloader pattern) | An afternoon, and it composes well with GraphQL. |
| A list that can grow without bound | Paginate, and select only the columns rendered | Also fixes the payload-size problem you have not noticed yet. |
| Deeply nested, read-only view | One hand-written SQL query into a flat view model | Highest effort, best result. Worth it for the two or three endpoints that matter most. |
Stopping the next one
Fixing the endpoint is the easy half. An N+1 is a class of bug, not an incident, and it will come back with the next relation somebody accesses in a loop — unless the codebase makes it loud.
Two guards do almost all the work. First, turn lazy loading into an error outside production: Eloquent has `Model::preventLazyLoading()`, Django has the `nplusone` package, Rails has `bullet`. The first developer to write the loop gets an exception in their own test run, which is about as early as feedback can arrive.
Second, assert the query count in tests for the endpoints that matter. It is a two-line test, it fails loudly on regression, and it documents the intended shape of the endpoint better than a comment. Add an alert on database calls per request in your APM and the loop is closed.
Assert that query count does not grow with row count. That single property is what separates an endpoint that scales from one that is merely fast today.
test('invoice list issues a fixed number of queries', async () => {
  await seedInvoices({ tenant, count: 5 })
  const small = await countQueries(() => api.get('/invoices'))

  await seedInvoices({ tenant, count: 200 })
  const large = await countQueries(() => api.get('/invoices'))

  // The number must not grow with the data. That is the entire assertion.
  expect(large).toBe(small)
  expect(large).toBeLessThanOrEqual(5)
})

// Plus, in a non-production bootstrap:
//   Model::preventLazyLoading(! app()->isProduction());
// so the loop throws in development instead of shipping.What it was worth
The endpoint went from 18.6 seconds to 240 milliseconds for the largest tenant, and the change was three lines plus pagination. Database load dropped across the board, because those four million lookups a day were a meaningful share of everything the instance was doing.
The part worth remembering is not the fix — it is that nobody could find it for a year while looking directly at it. Every tool they used ranked by duration, and the bug's defining characteristic is that it is never slow.
Rank by total time. Count queries per request. Assert the count in CI. Three habits, and this class of bug stops reaching production.
| Measure | Before | After |
|---|---|---|
| Largest tenant, p95 | 18.6 s | 240 ms |
| Queries per request | 32,041 | 3 |
| Database queries per day | ~4.1 M | ~9 K |
| Response payload | 6.4 MB | 48 KB |
| Lines of code changed | — | 3, plus pagination |
Frequently asked questions
What is the N+1 query problem?
One query fetches a list of N rows, then the code touches a relation on each row and the ORM quietly issues one more query per row — N+1 queries in total, or worse with several relations. Each query is fast and correctly indexed, so nothing looks wrong; the endpoint is slow only because it makes thousands of round trips.
Why doesn't the slow query log catch N+1 queries?
Because it ranks by per-call duration and an N+1 is defined by being individually fast. A 0.4ms primary-key lookup will never cross a slow-query threshold no matter how many times it runs. Rank by total execution time in pg_stat_statements instead, or count queries per request — both surface it immediately.
How do I detect N+1 queries in production?
Three ways, in increasing order of effort. Sort APM endpoints by database call count rather than duration. Query pg_stat_statements ordered by total_exec_time and look for a single-row lookup with an enormous call count. Or add middleware that counts queries per request and warns above a threshold — that one finds every N+1 in an application within a day of normal traffic.
Does eager loading always fix it?
It fixes the common case, where a relation is accessed in a loop, by turning N queries into one. It does not help when you are counting related rows — use the ORM's count helper so the database returns a number rather than the rows — and it can make things worse if you eager load relations you never read. Load what the response uses, nothing more.
Is an N+1 ever acceptable?
For a fixed, small N, yes. Three extra queries on a detail page nobody loads in a loop is not worth engineering away. The problem is specifically N that grows with your data or your customers, because it converts your most successful accounts into your worst-performing ones.
How do I stop N+1 queries reaching production again?
Make lazy loading throw outside production — Eloquent's preventLazyLoading, Rails' bullet, Django's nplusone — so the developer who writes the loop sees it in their own test run. Then assert in CI that a list endpoint's query count does not change when you seed more rows. That property, not a number, is what you want to protect.