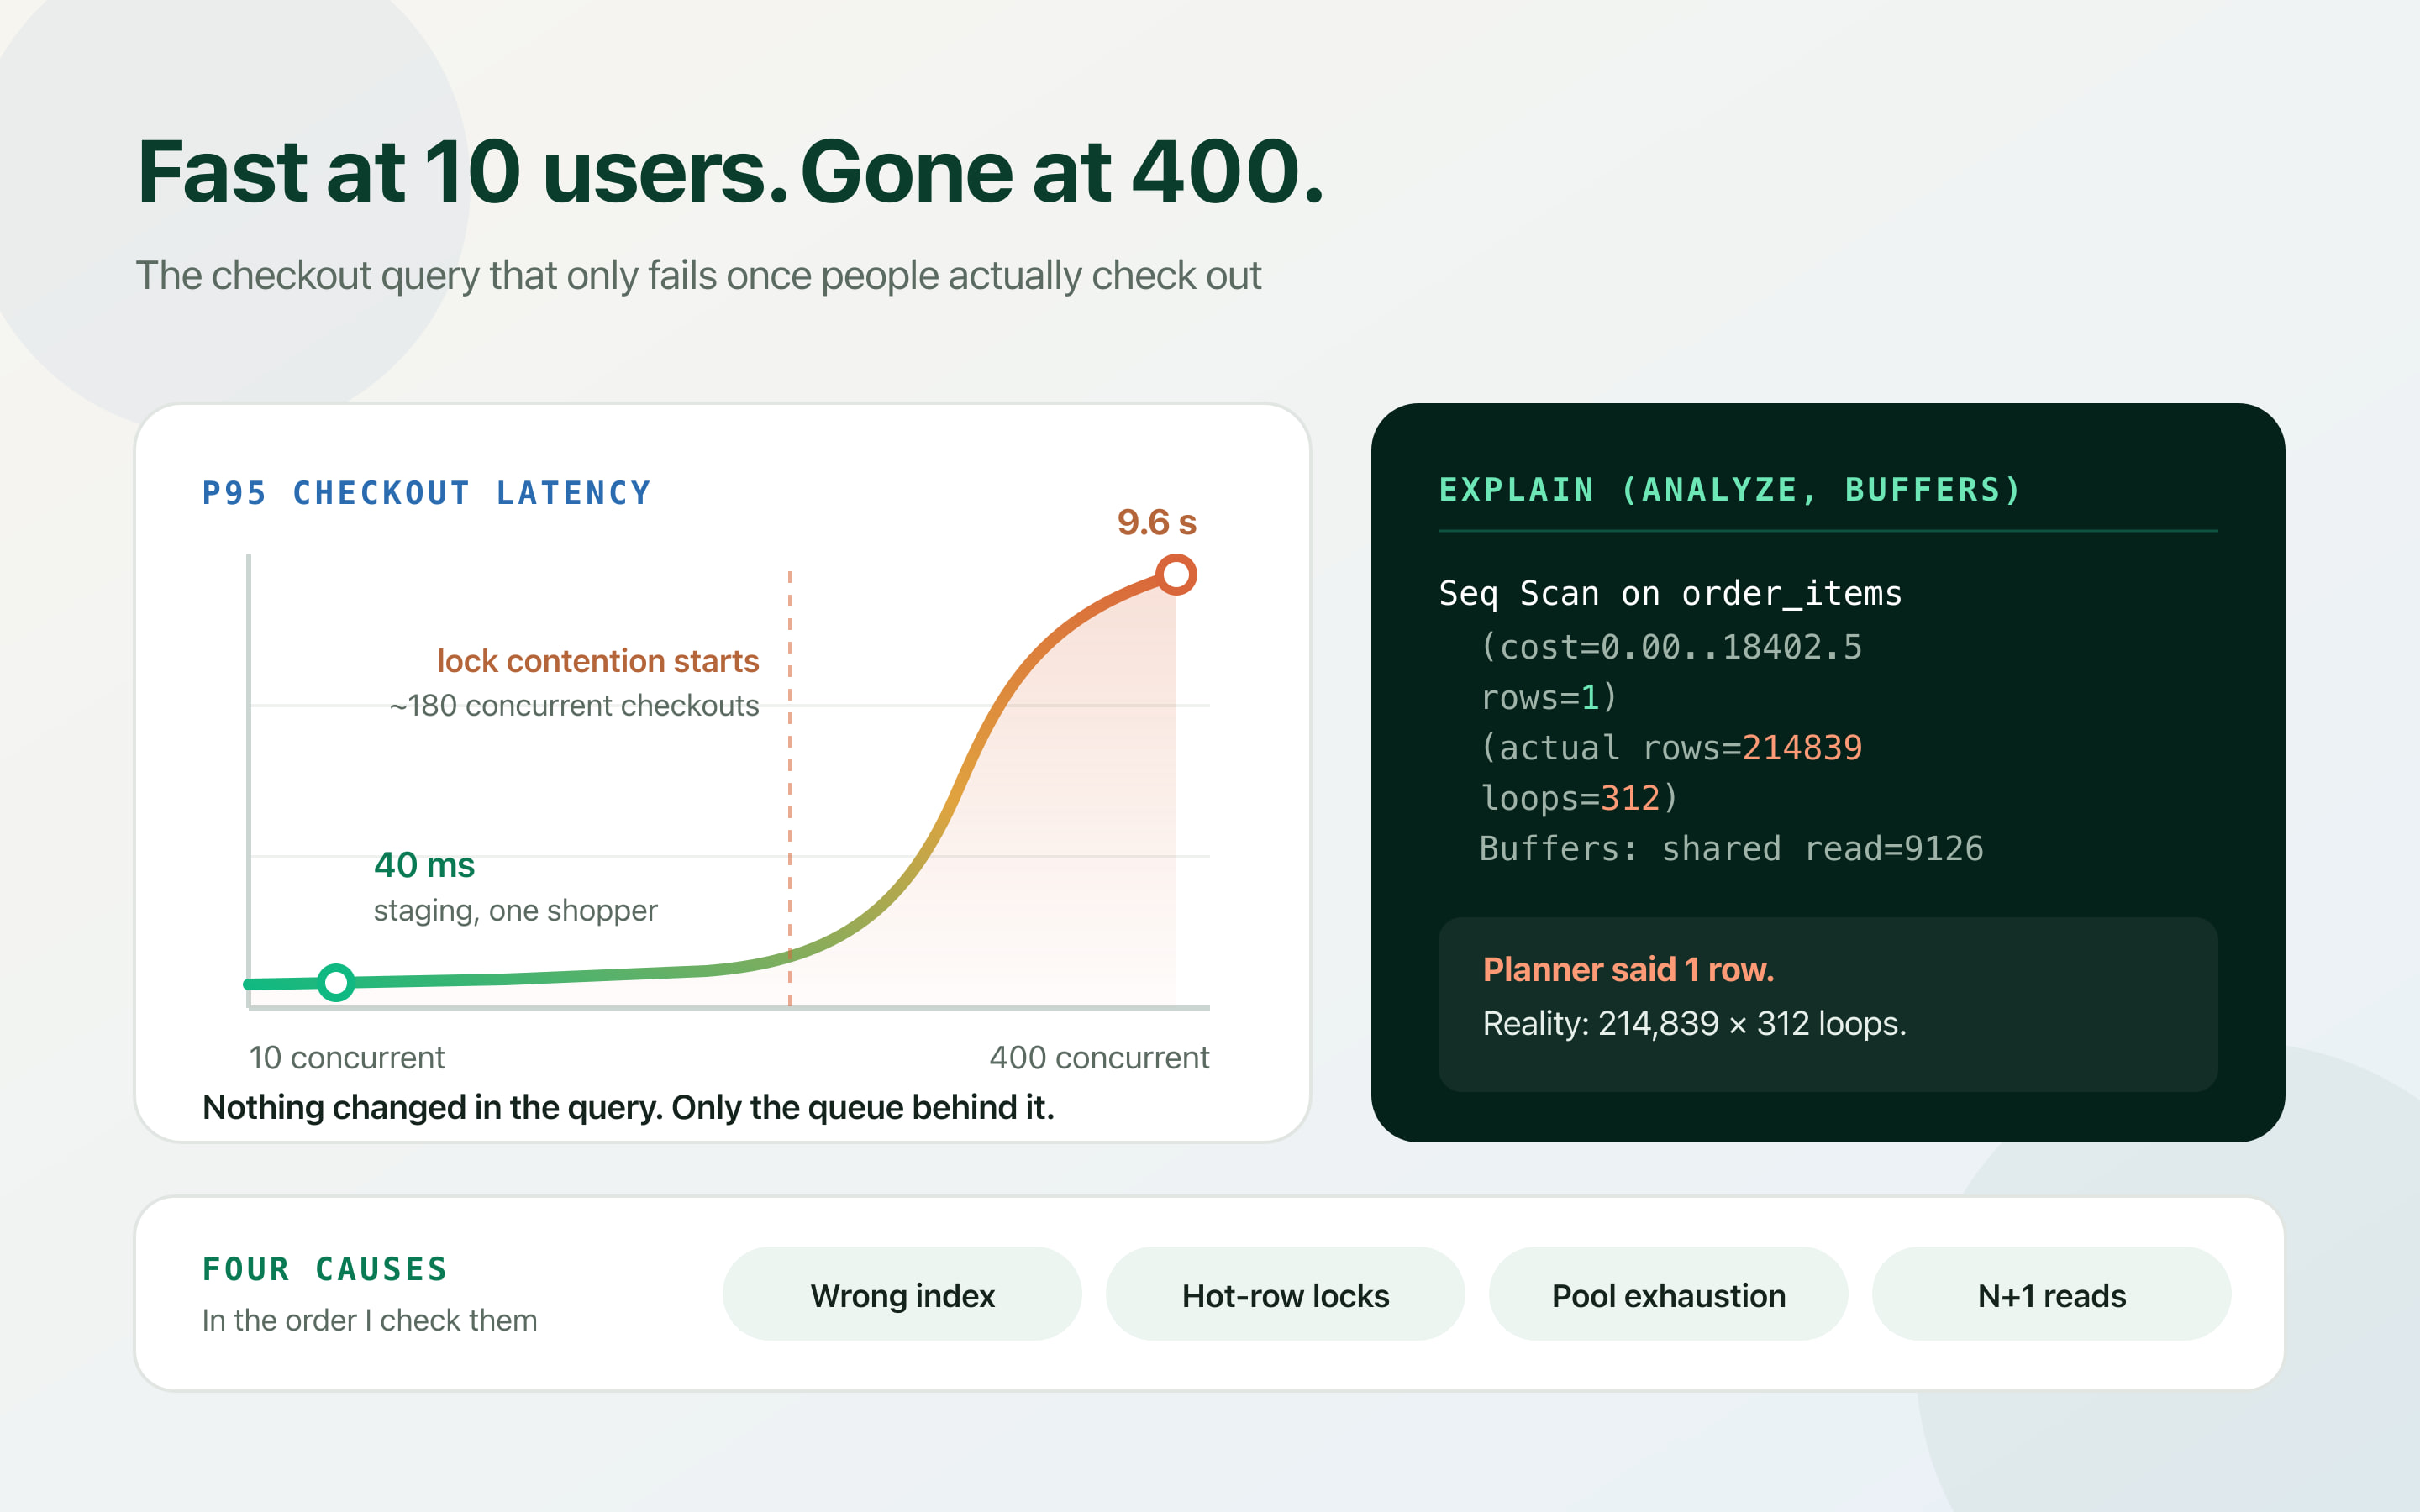
A checkout endpoint that takes 40ms with one shopper and 9.6 seconds with four hundred has not become a slow query. It has become a queue — and you cannot fix a queue by making the query 10% faster.
The pattern is always the same. Checkout is fine in staging, fine in the first months of production, fine right up until a campaign works. Then the p95 goes vertical, support fills with abandoned carts, and somebody suggests a bigger database instance.
A bigger instance sometimes helps. More often it buys a few weeks, because the thing that broke was not throughput — it was contention. One row, one missing index, or one pool of sixteen connections is serialising work that looks parallel from the outside.
Below is the order I actually work through: read the plan, find what is holding locks, count the connections, then look for the N+1. Three of the four fixes are a single migration or a config change.
Checkout is the worst place to be slow
Every slow endpoint costs you something, but checkout compounds in a way a dashboard does not. A slow report annoys one person who is already committed. A slow checkout loses the sale, and it loses it at the exact moment the customer had their card out.
Worse, checkout is where contention lives. It is the one transaction that touches inventory, pricing, payment state and order history in the same breath — usually with a row lock somewhere in the middle. Every other request for that product now waits behind it.
So measure the right number. A mean of 300ms hides the fact that one request in twenty takes six seconds; it is that tail that maps onto abandoned carts. Track p95 and p99 under concurrency, not the average on an idle box.
If your latency graph is flat and then vertical rather than a gentle slope, stop looking for a slow query. Cliffs are made by queues — a lock, a pool, or a saturated disk.
Read the plan before you touch an index
The single most common mistake is adding indexes by intuition. Postgres will tell you exactly what it did if you ask it properly, and the two options that matter are ANALYZE (actually run it, report real timings) and BUFFERS (show what came from cache versus disk).
Three things in that output tell you almost everything. First, the gap between the planner's estimated rows and the actual rows — if the planner expected 1 and got 214,839, it chose a strategy for a problem you do not have. Second, loops: a nested loop executing 312 times is an N+1 in disguise. Third, shared read versus shared hit: reads are trips to disk, hits came from memory.
Run it against production-shaped data. A plan derived from fifty rows on a laptop is a plan for a database that does not exist.
- Estimate vs actual: An order-of-magnitude gap means stale statistics or a correlation the planner cannot see. Run ANALYZE on the table before you conclude anything else.
- Loops greater than 1: The node ran once per outer row. Multiply the per-loop time by the loop count — that is the real cost, and it is the number people misread most often.
- Buffers: shared read: High reads with low hits means the working set no longer fits in memory. That is sometimes a genuine hardware answer, but check index size first.
EXPLAIN (ANALYZE, BUFFERS, FORMAT TEXT)
SELECT o.id, o.total_cents, oi.product_id, oi.qty
FROM orders o
JOIN order_items oi ON oi.order_id = o.id
WHERE o.user_id = 48219
  AND o.status = 'pending'
ORDER BY o.created_at DESC
LIMIT 20;

-- Read these three things, in this order:
--   rows=1 vs actual rows=214839   -> the planner is working blind
--   loops=312                       -> this node ran 312 times
-- shared read=9126 -> 9126 blocks came off disk, not cacheCause 1 — the index does not match the query you run
Most checkout tables do have indexes. They are just indexed for a query nobody runs. A single-column index on user_id cannot serve a lookup that filters on user_id and status and then sorts by created_at; Postgres will use it to find the user's rows and then sort the rest by hand.
Composite index column order is not cosmetic. Put equality columns first, then the range or sort column. That lets one index satisfy the filter and deliver rows already in the right order, which removes the sort node entirely.
If you only ever query one slice of the table — pending orders, say, which are a tiny fraction of all orders ever placed — a partial index is dramatically smaller, which means it stays in memory and stays fast as the table grows.
Use CREATE INDEX CONCURRENTLY on any table serving live traffic. A plain CREATE INDEX takes a lock that blocks writes for the entire build — which on a large orders table means taking checkout down to make checkout faster.
-- What most schemas have
CREATE INDEX idx_orders_user ON orders (user_id);

-- What the query above actually needs:
-- equality columns first, then the column you sort on
CREATE INDEX idx_orders_user_status_created
  ON orders (user_id, status, created_at DESC);

-- Better still if 'pending' is a small slice of a huge table.
-- Smaller index, stays cached, no bloat from historical rows.
CREATE INDEX CONCURRENTLY idx_orders_pending
  ON orders (user_id, created_at DESC)
  WHERE status = 'pending';

-- CONCURRENTLY does not take a write lock. On a live checkout table,
-- never build an index without it.Cause 2 — one row everyone has to queue behind
This is the one that produces the cliff, and it is almost never visible in a query plan. Checkout usually decrements stock, which means SELECT ... FOR UPDATE on the product row so two shoppers cannot buy the last unit. That is correct. The problem is what happens while the lock is held.
If the payment provider is called inside that transaction, the row lock is held for the entire network round trip. Eight hundred milliseconds of someone else's latency becomes eight hundred milliseconds that every other shopper for that product spends waiting. Your maximum throughput for a popular item is now roughly one checkout per second, no matter how many web servers you run.
The fix is not a faster query. It is moving everything that is not a database write out from between BEGIN and COMMIT — authorise the payment first, then open a short transaction that only reserves stock and records the order.
- Never call an external service inside a transaction: You have handed control of your lock duration to a company you do not run. Their p99 becomes your p99, multiplied by everyone queued behind the row.
- Prefer a conditional UPDATE to SELECT FOR UPDATE: UPDATE ... WHERE stock > 0 takes the lock and releases it in the same statement. Check the affected row count to detect the sold-out case.
- Reach for SKIP LOCKED on queue tables: When workers pull jobs from a table, SELECT ... FOR UPDATE SKIP LOCKED lets each worker take the next unlocked row instead of every worker queueing for the same one.
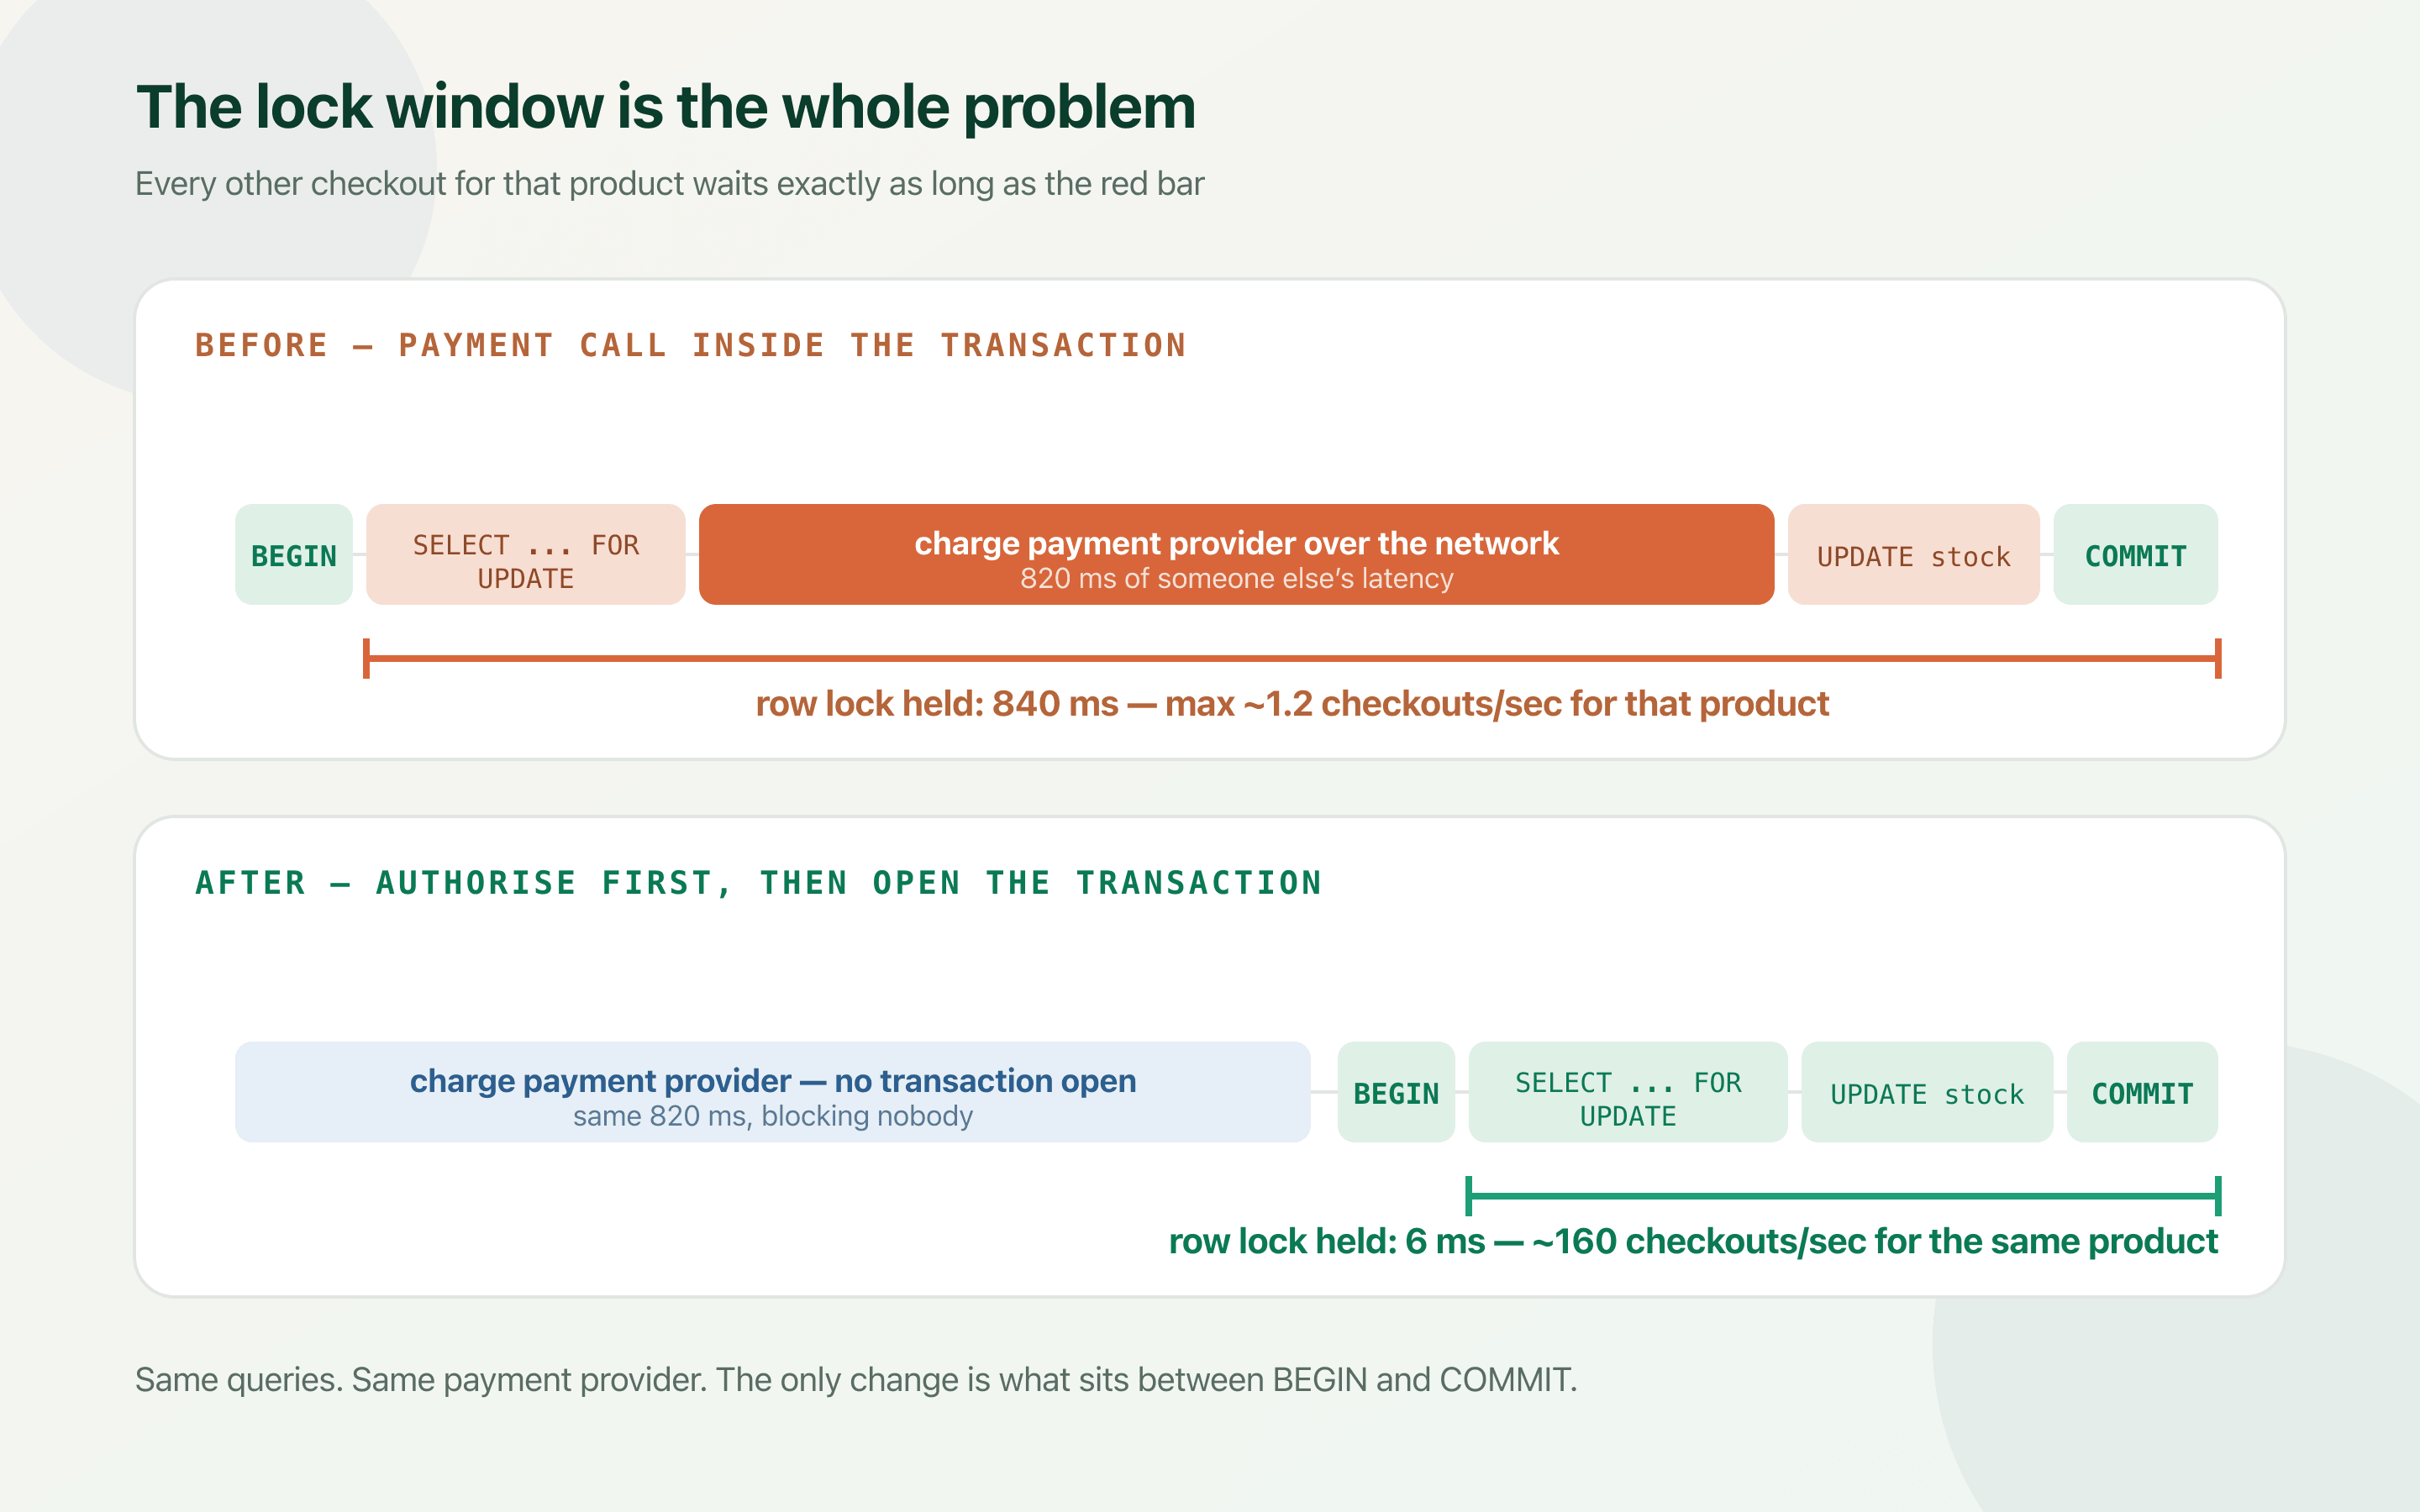
-- BEFORE: the row lock spans a third-party API call
BEGIN;
  SELECT stock FROM products WHERE id = 91 FOR UPDATE;
  --  ... application calls the payment provider here ...
  --  ... 820ms during which nobody else can buy product 91 ...
  UPDATE products SET stock = stock - 1 WHERE id = 91;
  INSERT INTO orders (...) VALUES (...);
COMMIT;

-- AFTER: authorise first, then a transaction that only touches the database
--  1. charge the provider, no transaction open
--  2. then:
BEGIN;
  UPDATE products
     SET stock = stock - 1
   WHERE id = 91 AND stock > 0;     -- conditional update, no explicit lock
  INSERT INTO orders (...) VALUES (...);
COMMIT;

-- If zero rows were updated, stock ran out: refund the authorisation.
-- Handling that case is cheaper than serialising every shopper.Cause 3 — you ran out of connections, not CPU
A database at 15% CPU that still times out is telling you something specific: requests are waiting for a connection, not for work. Postgres handles each connection with a backend process, so max_connections is not a number you can raise indefinitely — a few hundred is usually where memory and context-switching start to hurt.
Serverless makes this sharply worse. Every cold function instance opens its own connection, so a traffic spike that starts fifty instances opens fifty connections for work that needs a handful. This is the single most common way an AI-generated or quickly-scaffolded backend falls over, because the default in most tutorials is a client per invocation.
A transaction-mode pooler in front of the database is the fix, and it is a config change rather than a code change. A few hundred application connections multiplex onto a few dozen real ones.
| What you see | What it usually means | What to change |
|---|---|---|
| Timeouts with low database CPU | Requests are queued waiting for a free connection | Put PgBouncer (transaction mode) in front; size the app pool below max_connections. |
| “too many clients already” | max_connections reached, often from serverless cold starts | Pooler, plus a single shared client per instance rather than one per invocation. |
| High CPU, plans look fine | Genuinely more work than the instance can do | This is the case where more hardware is the honest answer. |
| Latency cliff at a specific concurrency | A lock or a pool limit, not gradual saturation | Find the serialisation point before buying anything. |
Cause 4 — the N+1 hiding in the order summary
The checkout response usually needs line items, and the natural way to write that is a loop. One query for the order, then one per item to fetch the product. With three items in a test cart that is four queries and nobody notices. With a realistic basket and a few hundred concurrent shoppers it is thousands of round trips competing for the same connections you just ran out of.
Each individual query is fast, which is what makes this so durable — it never shows up as a slow query in any log. It shows up as an endpoint that is inexplicably slow while every query it runs is inexplicably fast.
pg_stat_statements finds it instantly, because it ranks by total time rather than per-call time. The N+1 is the query with an unremarkable mean and an enormous call count.
Sort by total time and the answer is usually in the top three rows. Sorting by mean time is how an N+1 stays hidden for a year.
CREATE EXTENSION IF NOT EXISTS pg_stat_statements;

SELECT
  calls,
  round(mean_exec_time::numeric, 2)  AS mean_ms,
  round(total_exec_time::numeric)    AS total_ms,
  round(100 * total_exec_time / sum(total_exec_time) OVER (), 1) AS pct,
  left(query, 70) AS query
FROM pg_stat_statements
ORDER BY total_exec_time DESC
LIMIT 10;

-- The N+1 is the row with mean_ms around 0.4 and calls in the millions.
-- It will never appear in a slow query log, because it is never slow.Prove it with numbers, not vibes
Every fix above is easy to convince yourself of and easy to be wrong about. Load-test the endpoint at the concurrency that actually broke it, record p95 and p99, change one thing, and run it again.
The point is not the specific numbers — yours will differ. The point is that each of these fixes is a different shape of change, so knowing which one moved the needle tells you where the next bottleneck will appear.
# 60 seconds, 200 concurrent clients, reporting latency percentiles
pgbench -h db-host -U app -d shop \
        -f checkout.sql \
        -c 200 -j 8 -T 60 --progress=5

# What to record, before and after each single change:
#   p95 latency, p99 latency, transactions per second, database CPU
# Change one thing at a time or you will not know what worked.| Change | p95 | Why it moved |
|---|---|---|
| Baseline at 200 concurrent | 9.6 s | Payment call inside the transaction; everyone queues on one product row. |
| Payment call moved out of the transaction | 1.4 s | Lock window drops from ~840ms to single-digit milliseconds. |
| Composite partial index added | 410 ms | Sort node disappears; the index is small enough to stay in memory. |
| Line items batched, pooler added | 180 ms | Round trips collapse from thousands to two; connections stop queueing. |
Frequently asked questions
Why is my checkout query fast in staging and slow in production?
Almost always data volume or concurrency, not the query text. Staging has a few hundred rows so the planner picks a strategy that does not survive a million; and staging has one user so row-level lock contention never appears. Reproduce against a copy of production data at realistic concurrency before changing any code.
Should I add an index or upgrade the database instance?
Check the plan first. If EXPLAIN ANALYZE shows a sequential scan or a sort node on a filtered query, an index is a migration that costs nothing per month. Upgrade the instance only when CPU is genuinely saturated and the plans are already good — a bigger instance will not fix a lock that serialises shoppers behind one row.
What column order should a composite index use?
Equality filters first, then range conditions, then the column you sort by. An index on (user_id, status, created_at DESC) serves a query filtering on user_id and status and ordering by created_at, and removes the sort entirely. The same three columns in a different order may not be usable at all.
Is SELECT FOR UPDATE bad for checkout?
The lock is not the problem; how long you hold it is. Held for a couple of milliseconds around a stock decrement it is correct and cheap. Held across a payment API call it caps throughput for that product at roughly one checkout per second. Where possible, use a conditional UPDATE with a WHERE stock > 0 guard so the lock lives and dies inside a single statement.
Why does my database time out when CPU is low?
Requests are waiting for a connection rather than for work. Postgres allocates a process per connection, so max_connections is a hard ceiling, and serverless functions blow through it by opening one per cold instance. A transaction-mode pooler such as PgBouncer multiplexes hundreds of application connections onto a few dozen real ones, and it is a config change rather than a rewrite.
How do I find an N+1 query in Postgres?
Query pg_stat_statements ordered by total_exec_time rather than mean_exec_time. An N+1 is individually fast, so it never appears in a slow query log — it shows up as a query with an unremarkable mean and an enormous call count. In EXPLAIN ANALYZE output the same thing appears as a nested loop with a high loops value.