Storage is the one line on a database bill that is charged several times over — once for the primary, again for the standby, again for each replica, and again for every snapshot. Halving it halves all of them at once.
The trigger is usually a threshold rather than a bill: storage autoscaled again, or peak-hour IOPS hitting a ceiling and queries queueing behind the disk. The instinct is to buy more of both.
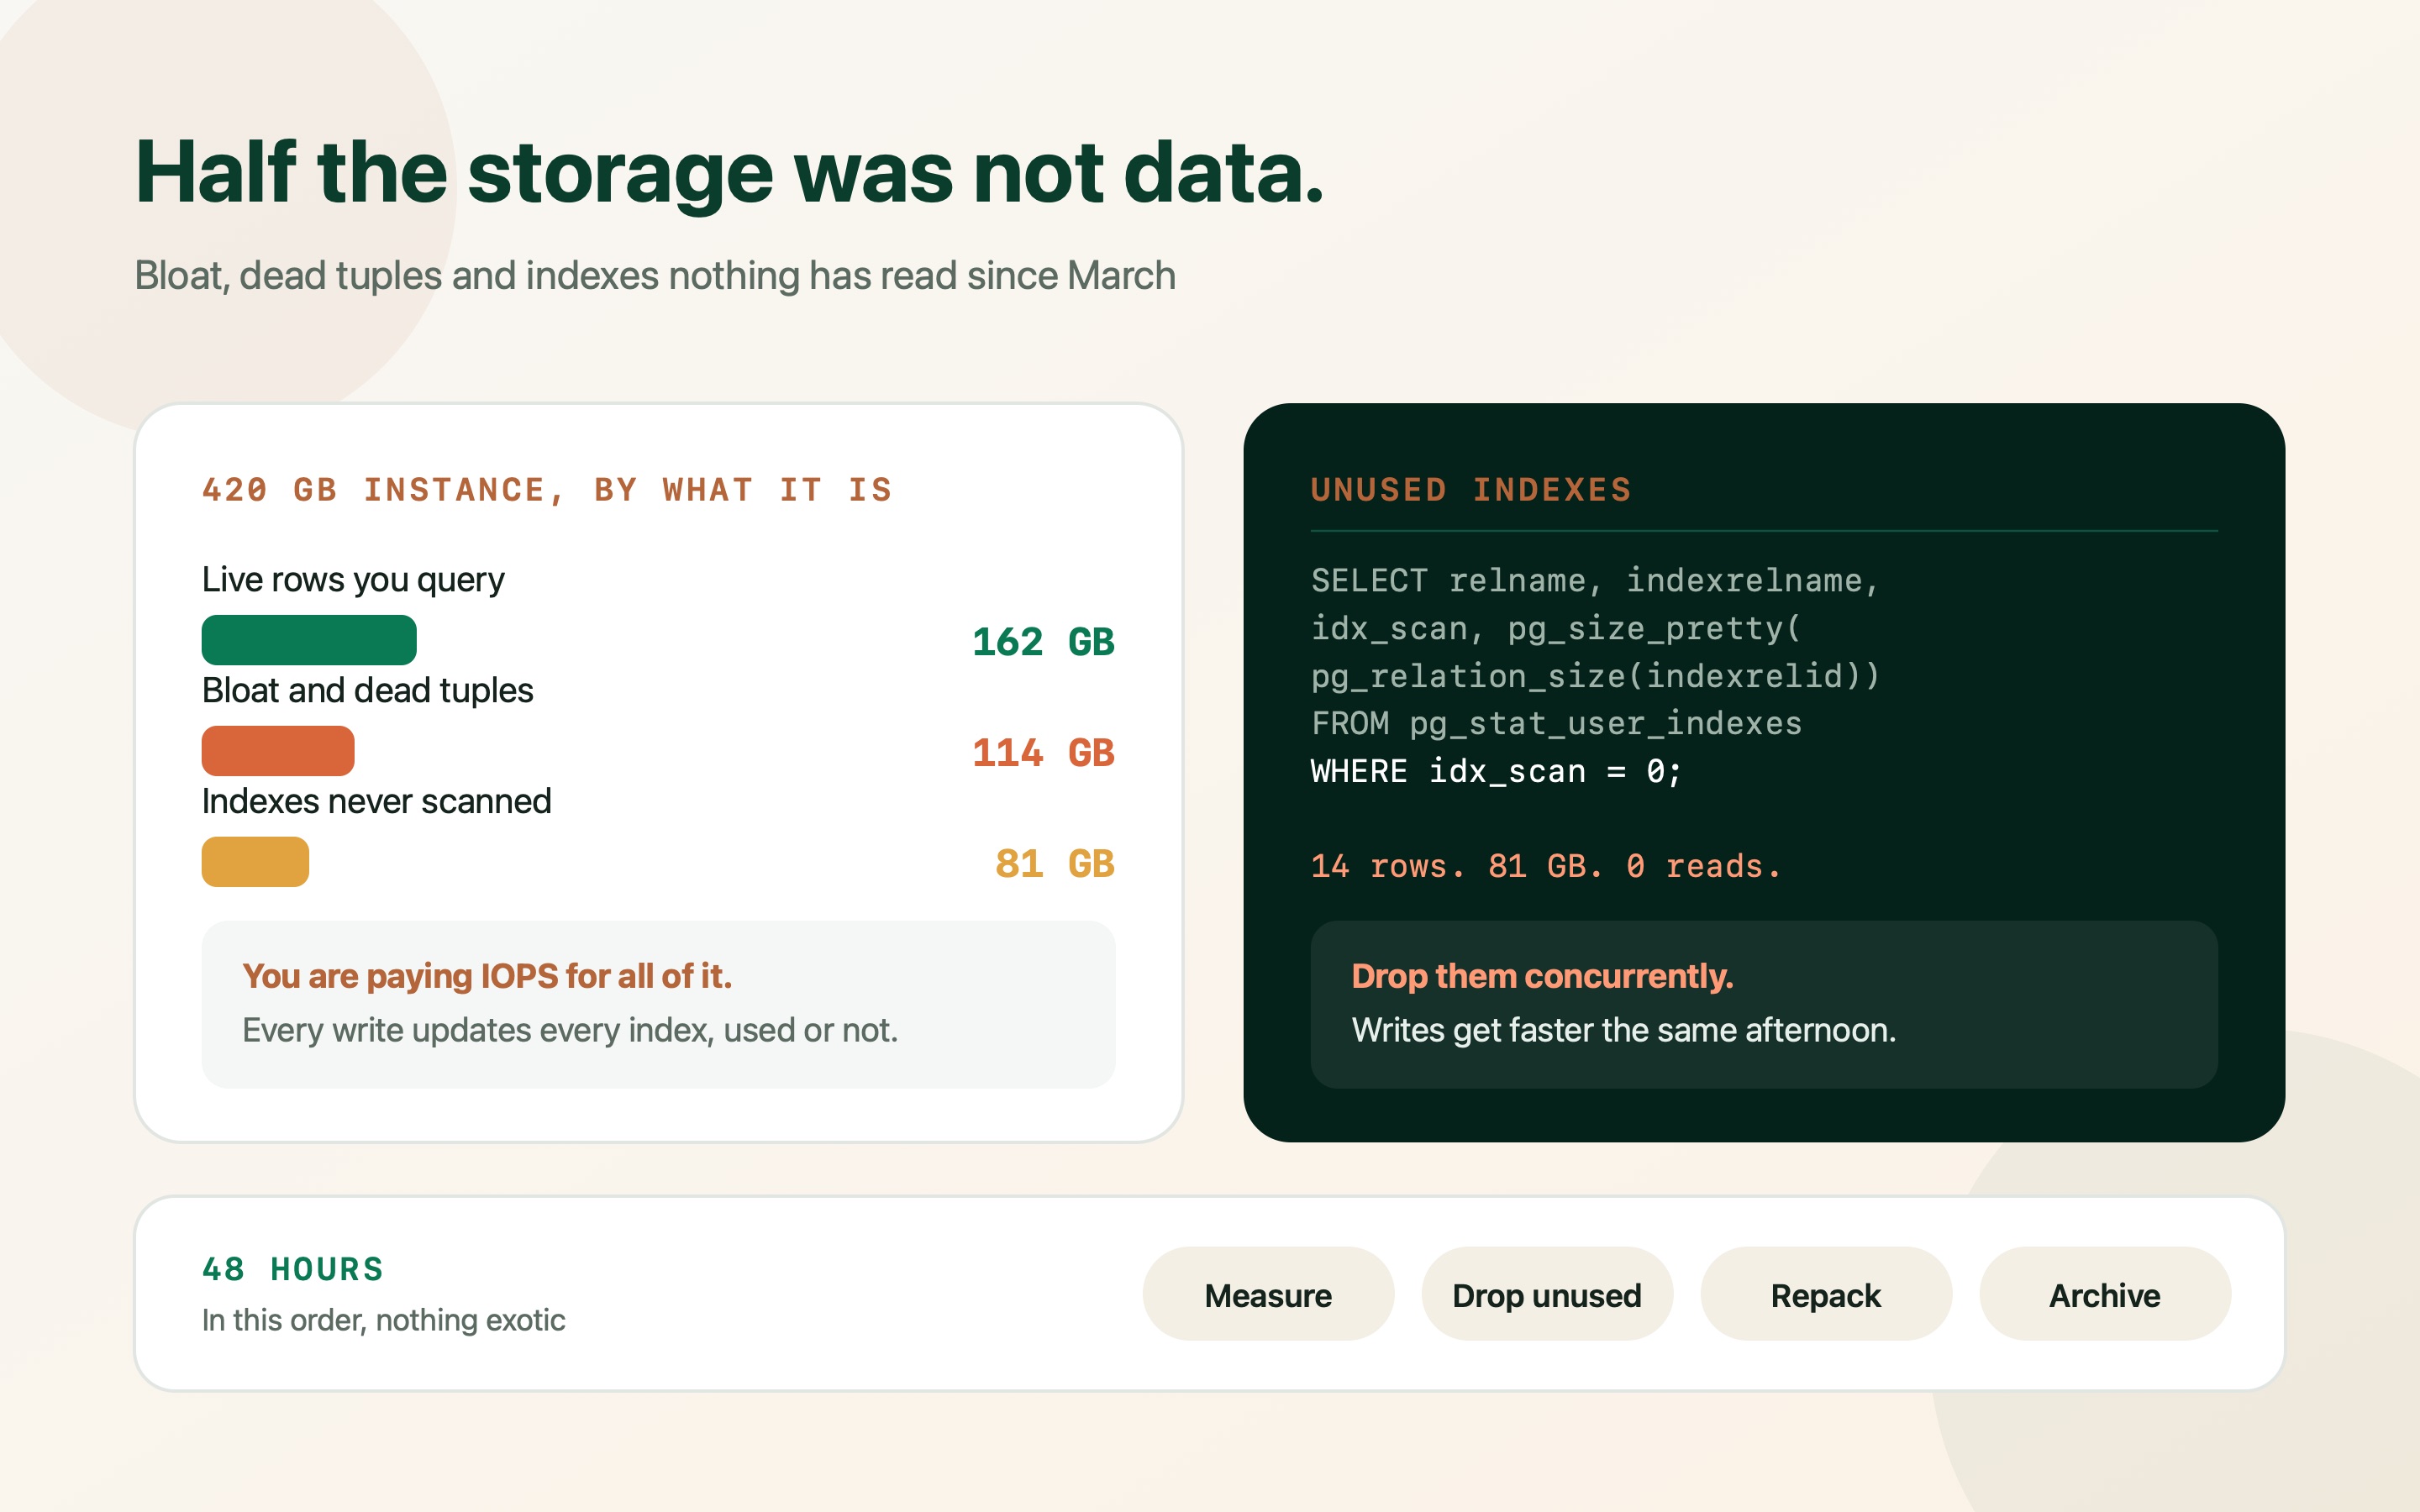
Before doing that, it is worth finding out what the storage is. In every large Postgres instance I have looked at, well under half of it was rows anyone queries. The rest was bloat left by updates, indexes created for a feature that shipped differently, TOASTed JSON nobody reads, and event tables that have been accumulating since launch.
The order below is deliberate: measure, then remove what nothing reads, then reclaim what is dead, then archive what is cold, and only then talk about the disk. Each step makes the next one cheaper, and the first three cost nothing but attention.
Storage is billed more times than you think
One gigabyte of table is rarely one gigabyte on the invoice. A Multi-AZ deployment keeps a standby copy. Each read replica keeps its own. Automated backups retain changed blocks for the retention window, and every manual snapshot holds what it captured for as long as it exists.
So a 420GB primary with a standby, two replicas and a month of backups is comfortably over a terabyte of billed storage. That multiplier is why reclaiming space is worth more than the primary's own price per gigabyte suggests.
IOPS follows the same logic in reverse. Every write has to be applied to indexes as well as the table, and shipped to the standby and replicas. An index nothing reads still costs write throughput on every insert and update — which is why dropping unused indexes usually makes the database faster, not just smaller.
Before optimising anything, multiply. Reclaiming 100GB on a primary with a standby and two replicas removes roughly 400GB of billed storage, and proportionally reduces the write IOPS needed to keep all of them in step.
Hour 1 — find out what the 420GB actually is
Start with the breakdown, not the total. `pg_total_relation_size` gives you a table plus its indexes plus its TOAST storage, and sorting by it tells you where to spend the next two days. It is common for two or three tables to be eighty percent of the instance.
Split table size from index size in the same query. A table whose indexes are larger than its data is either over-indexed or badly bloated, and the distinction matters because the fixes are different.
Write the numbers down before touching anything. Everything that follows should be measurable against this baseline, and you will want the comparison when someone asks what the two days bought.
SELECT
  relname                                                   AS table,
  pg_size_pretty(pg_total_relation_size(c.oid))             AS total,
  pg_size_pretty(pg_relation_size(c.oid))                   AS heap,
  pg_size_pretty(pg_indexes_size(c.oid))                    AS indexes,
  pg_size_pretty(COALESCE(pg_total_relation_size(reltoastrelid), 0)) AS toast,
  n_live_tup,
  n_dead_tup
FROM pg_class c
JOIN pg_namespace n ON n.oid = c.relnamespace
LEFT JOIN pg_stat_user_tables s ON s.relid = c.oid
WHERE c.relkind = 'r' AND n.nspname NOT IN ('pg_catalog', 'information_schema')
ORDER BY pg_total_relation_size(c.oid) DESC
LIMIT 20;

-- What to look for:
--   indexes larger than heap      -> over-indexed, or index bloat
--   large toast                   -> big JSONB or text columns
--   n_dead_tup close to n_live_tup-> vacuum is not keeping up
-- one table over half the total -> that is your whole projectHour 2 — drop the indexes nothing has read
This is the highest-return half hour in the exercise, and it improves performance as well as cost. `pg_stat_user_indexes` records how many times each index has been scanned. Indexes with zero scans since the last statistics reset are pure overhead: they occupy storage, they consume write IOPS on every insert and update, and they slow down vacuum.
Two caveats before dropping anything. Check the replicas too — statistics are per-node, so an index used only by a reporting replica shows zero scans on the primary. And never drop an index backing a primary key, a unique constraint or a foreign key without understanding what enforces that constraint afterwards.
Drop concurrently so nothing takes a heavy lock, and keep the DDL to recreate each one in the same pull request. That makes the change genuinely reversible, which is what turns a nervous conversation into a routine one.
- Every index is a write tax: An insert updates the table and every index on it. Fourteen unused indexes on a hot table is fourteen extra writes per row, forever.
- Duplicate and redundant indexes are common: An index on (tenant_id) is redundant when (tenant_id, created_at) exists — the composite serves both. Look for prefixes, not just zero scans.
- Reset statistics after a full business cycle, not before: Monthly reports use indexes once a month. Judge on at least one full cycle, or you will drop the index that runs the invoicing job.
SELECT
  s.relname                                   AS table,
  s.indexrelname                              AS index,
  s.idx_scan                                  AS scans,
  pg_size_pretty(pg_relation_size(s.indexrelid)) AS size,
  i.indisunique                               AS is_unique,
  i.indisprimary                              AS is_primary
FROM pg_stat_user_indexes s
JOIN pg_index i ON i.indexrelid = s.indexrelid
WHERE s.idx_scan = 0
  AND NOT i.indisprimary
  AND NOT i.indisunique
ORDER BY pg_relation_size(s.indexrelid) DESC;

-- Check when the counters were last reset, or "zero scans" means nothing:
SELECT stats_reset FROM pg_stat_database WHERE datname = current_database();

-- Run the same query on every replica before deciding.
-- Then, one at a time, with the recreate statement saved:
DROP INDEX CONCURRENTLY idx_invoices_legacy_status;Hours 3–8 — reclaim the space updates left behind
Postgres never updates a row in place: it writes a new version and marks the old one dead. Autovacuum reclaims that space for reuse, but on a busy table it can fall behind, and space reclaimed for reuse is not space returned to the filesystem. The result is a table physically much larger than the data in it.
Check dead tuples and the last autovacuum time first. If a large, busy table has not been autovacuumed in days, the usual cause is not the thresholds — it is a long-running transaction holding back the vacuum horizon, so vacuum runs but cannot remove anything. Find that transaction before tuning anything.
To return space to the disk you need a rewrite. `VACUUM FULL` does it but takes an exclusive lock for the duration, which on a 100GB table means an outage. `pg_repack` does the same work online, with only brief locks at the start and end. It needs disk headroom equal to the table being rebuilt, which is worth checking before you start.
SELECT
  relname,
  n_live_tup,
  n_dead_tup,
  round(100.0 * n_dead_tup / NULLIF(n_live_tup + n_dead_tup, 0), 1) AS dead_pct,
  last_autovacuum,
  autovacuum_count
FROM pg_stat_user_tables
WHERE n_dead_tup > 50000
ORDER BY n_dead_tup DESC;

-- Over ~20% dead on a hot table is worth acting on.
-- If last_autovacuum is days old, look here before tuning thresholds:
SELECT pid, state, now() - xact_start AS xact_age, left(query, 60)
FROM pg_stat_activity
WHERE xact_start IS NOT NULL
ORDER BY xact_start
LIMIT 5;
-- An hours-old transaction pins the horizon: vacuum runs, removes nothing.

-- Then rewrite online, one table at a time, off-peak:
--   pg_repack -h host -U app -d app -t public.invoice_events --no-order
--
-- And make autovacuum more aggressive on the tables that churn:
ALTER TABLE invoice_events SET (
  autovacuum_vacuum_scale_factor = 0.02,   -- default 0.2 is far too lazy at scale
  autovacuum_vacuum_cost_limit   = 2000
);Hours 9–16 — the JSONB column that is half your TOAST
Storing the raw payload of every webhook, API response or event in a JSONB column is convenient and quietly enormous. Because large values are TOASTed out of line, the table looks reasonable while the TOAST relation grows without anybody watching it.
Three fixes, in order of return. Stop storing what you never read — raw provider payloads are usually kept “just in case”, and S3 is roughly two orders of magnitude cheaper per gigabyte than database storage for exactly that. Extract the two or three keys you actually query into real columns, which also makes them indexable and far cheaper to read. And on PostgreSQL 14 and later, switch TOAST compression to LZ4, which is substantially faster than the default and usually compresses this kind of payload well.
If you genuinely query inside the JSON, index it properly. A GIN index with `jsonb_path_ops` is considerably smaller than the default GIN operator class when you only need containment queries — and a plain B-tree on an extracted expression beats both when you always filter on the same key.
-- Which tables are mostly out-of-line values
SELECT
  c.relname,
  pg_size_pretty(pg_relation_size(c.oid))                  AS heap,
  pg_size_pretty(pg_total_relation_size(c.reltoastrelid))  AS toast
FROM pg_class c
WHERE c.reltoastrelid <> 0
ORDER BY pg_total_relation_size(c.reltoastrelid) DESC
LIMIT 10;

-- PG14+: LZ4 is faster and usually smaller for JSON payloads
ALTER TABLE webhook_events ALTER COLUMN payload SET COMPRESSION lz4;
-- applies to new rows; a rewrite (pg_repack) converts the existing ones

-- Extract what you actually query into a real column
ALTER TABLE webhook_events ADD COLUMN event_type text
  GENERATED ALWAYS AS (payload ->> 'type') STORED;
CREATE INDEX CONCURRENTLY ON webhook_events (event_type, created_at DESC);

-- If you must search inside the document, use the smaller operator class
CREATE INDEX CONCURRENTLY idx_events_payload
ON webhook_events USING gin (payload jsonb_path_ops);Hours 17–40 — archive the rows nobody queries
In most SaaS databases, one or two append-only tables — events, audit log, notifications, webhook deliveries — are the majority of the storage, and the overwhelming majority of their rows have never been read after the week they were written.
Partitioning by month turns deletion into metadata. With a partitioned table you `DETACH` last year's partition, export it to S3 or Parquet if you need it for compliance, and drop it. That takes seconds and returns the space immediately, where a `DELETE` of ten million rows generates enormous WAL, leaves the space bloated, and needs a repack afterwards anyway.
Converting an existing large table to a partitioned one is the real work, which is why this step takes a day rather than an hour. Do it once, and the retention policy becomes a cron job that costs nothing forever.
-- The target shape: one partition per month
CREATE TABLE invoice_events (
  id          bigserial,
  tenant_id   bigint      NOT NULL,
  created_at  timestamptz NOT NULL,
  payload     jsonb
) PARTITION BY RANGE (created_at);

CREATE TABLE invoice_events_2026_09 PARTITION OF invoice_events
  FOR VALUES FROM ('2026-09-01') TO ('2026-10-01');

-- Monthly retention becomes a metadata operation, not a DELETE:
ALTER TABLE invoice_events DETACH PARTITION invoice_events_2025_09;
--   ... export it, then:
DROP TABLE invoice_events_2025_09;

-- Space returns immediately. No bloat, no repack, almost no WAL.

-- Migrating an existing table: create the partitioned parent alongside,
-- backfill in batches, swap names in a short transaction. Keep the old
-- table until you are sure, then drop it.| Table | Typical policy | What it returns |
|---|---|---|
| Webhook deliveries | 30–90 days hot, then S3 | Usually the single largest reclaim |
| Audit log | 13 months hot (compliance), then cold storage | Large, and legally the one to check before touching |
| Notifications | 90 days, then delete | High row count, low value after a week |
| Analytics events | Move to a warehouse entirely | Should not be in the transactional database at all |
| Soft-deleted rows | Purge after 90 days | Invisible in the application, fully billed |
Hours 41–48 — only now, the disk and the IOPS
With the space reclaimed, resizing becomes a real conversation rather than a guess. Two things are worth knowing before it.
On RDS, allocated storage can grow but cannot shrink. Reducing it means a dump and restore into a right-sized instance, which is a maintenance window — worth doing once when the gap is large, and worth avoiding by not over-allocating in the first place. On gp3, IOPS is purchased separately from capacity, so you stop allocating extra terabytes purely to reach an IOPS number, which is the trap gp2 sets.
The IOPS side usually resolves itself. Dropping unused indexes cuts write amplification; repacking reduces pages touched per query; archiving shrinks the working set until it fits in memory again, which converts disk reads into cache hits. Check the cache hit ratio before buying provisioned IOPS — under 99% on an OLTP workload usually means the working set no longer fits, and that is cheaper to fix by shrinking the data than by renting IOPS at roughly two cents per provisioned IOPS-month on gp3, or around ten cents on io1.
SELECT
  round(100.0 * sum(heap_blks_hit)
        / NULLIF(sum(heap_blks_hit) + sum(heap_blks_read), 0), 2) AS cache_hit_pct
FROM pg_statio_user_tables;

-- > 99%   the working set is in memory; buying IOPS will change little
-- 90-99%  borderline; archiving and index cleanup usually fixes it
-- < 90%   genuinely reading from disk — shrink the data first, then decide

-- Per-table, to find which one is causing the reads:
SELECT relname,
       heap_blks_read,
       heap_blks_hit,
       round(100.0 * heap_blks_hit
             / NULLIF(heap_blks_hit + heap_blks_read, 0), 1) AS hit_pct
FROM pg_statio_user_tables
ORDER BY heap_blks_read DESC
LIMIT 10;| Step | Reclaimed | Side effect |
|---|---|---|
| Dropped 14 never-scanned indexes | 81 GB | Writes measurably faster; vacuum cheaper |
| pg_repack on three bloated tables | 96 GB | Sequential scans faster; cache hit ratio up |
| LZ4 + payload trimmed to what is read | 34 GB | TOAST reads drop sharply |
| Archived events older than 90 days | 71 GB | Retention now a monthly cron, not a project |
| Total on the primary | 282 GB of 420 GB | Multiplied across standby, replicas and snapshots |
Frequently asked questions
Why is my Postgres database so much bigger than my data?
Three usual reasons. Updates leave dead row versions that vacuum reclaims for reuse but does not return to the filesystem, so a churned table stays physically large. Indexes are counted in the total and are often larger than the table itself. And large JSON or text columns are stored out of line in TOAST, which grows quietly. Measure heap, indexes and TOAST separately before concluding anything.
Is it safe to drop an index with zero scans?
Usually, with two checks. Statistics are per-node, so run the same query on every replica — an index used only by reporting will show zero scans on the primary. And never drop one backing a primary key, unique constraint or foreign key. Drop concurrently, one at a time, keeping the recreate statement so the change is genuinely reversible.
VACUUM FULL or pg_repack?
pg_repack for anything in production. VACUUM FULL rewrites the table while holding an ACCESS EXCLUSIVE lock, so a 100GB table means an outage of that length. pg_repack does the same rebuild online with only brief locks at the beginning and end. It needs free disk roughly equal to the table being rebuilt, so check headroom before starting.
Why is autovacuum not keeping up?
On a busy table the default autovacuum_vacuum_scale_factor of 0.2 means it waits until twenty percent of the rows are dead, which on a hundred-million-row table is twenty million rows. Lower it per table. But check first for a long-running transaction: while one is open, vacuum runs and removes nothing, because those row versions might still be visible to it.
Can I reduce allocated storage on RDS?
Not in place — allocated storage only grows. Reducing it requires a dump and restore into a right-sized instance, or a logical replication cutover if you need minimal downtime. That is why reclaiming space is worth doing before storage autoscaling fires, and why gp3 matters: you buy IOPS separately, so you stop over-allocating capacity to reach a throughput number.
Will this actually make the database faster, or just cheaper?
Both, usually. Dropping unused indexes removes write work on every insert and update. Repacking reduces the pages a scan must touch. Archiving cold rows shrinks the working set until it fits in memory, which turns disk reads into cache hits. It is common for the cache hit ratio and p95 latency to improve more than the storage bill does.