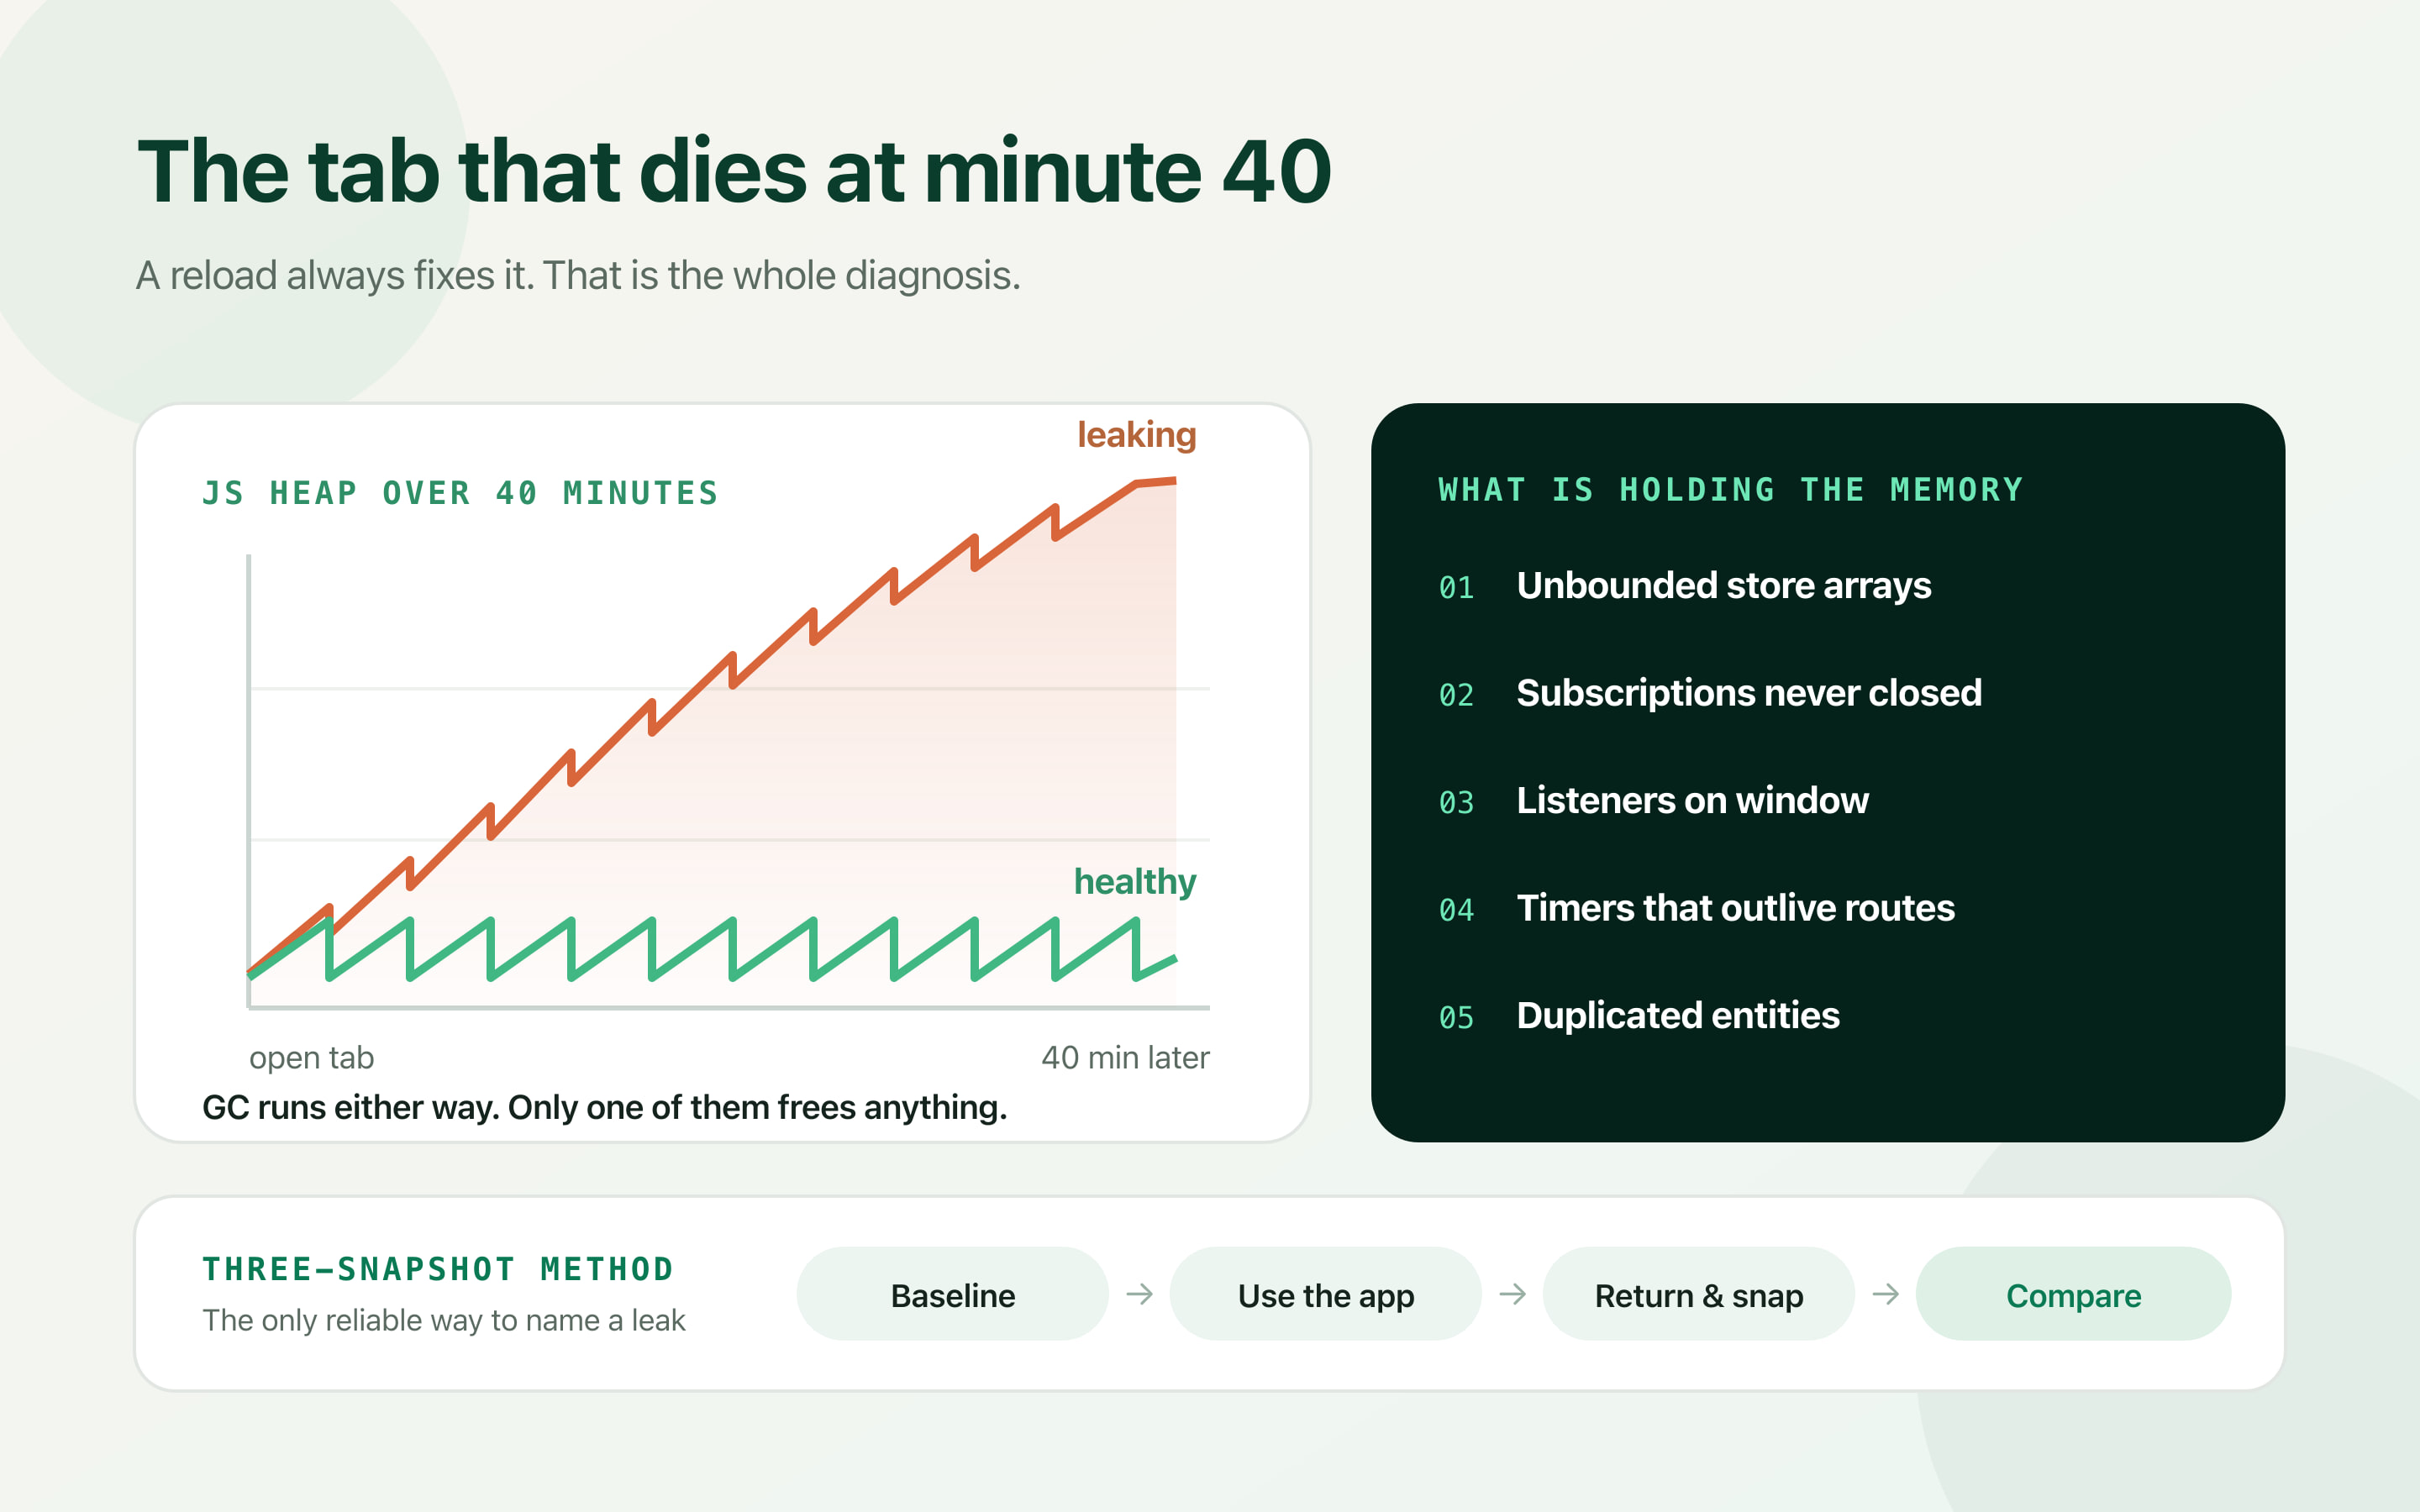
“It gets slow after a while, but a refresh fixes it.” If a user has ever said that to you, they have already handed you the diagnosis: nothing is wrong with your code on load, and something is accumulating while it runs.
Memory leaks in single-page apps are rare in the ordinary sense and routine in real-time ones. A marketing site is torn down and rebuilt on every navigation. A trading dashboard, a support inbox or a live chat panel stays mounted for hours, absorbing hundreds of messages a minute, and every small retention mistake compounds.
This is why they survive QA. Nobody tests an eight-hour session. The bug ships, users describe it as “the app gets sluggish”, and it gets triaged as vague performance work instead of the specific, findable object-retention problem it actually is.
The good news is that heap snapshots do not lie, and the set of things that cause this in a Vuex codebase is small. Below is the method I use to name the leak in about twenty minutes, and the five patterns it keeps finding.
Learn to read the shape before the snapshot
Open the Performance Monitor in Chrome DevTools, leave the app running under normal use for a few minutes, and watch the JS heap line. You are looking at the shape, not the number.
A healthy application produces a sawtooth: memory climbs as objects are allocated, garbage collection runs, and the line returns to roughly the same baseline it started from. The peaks move up and down; the troughs stay level.
A leaking application produces a staircase. Garbage collection still runs — you can see the small drops — but each trough is higher than the last, because a growing set of objects is still reachable and therefore cannot be collected. The distinction matters: a leak is not memory being used, it is memory that can never be given back.
Rising peaks mean nothing on their own; a busy app allocates hard. Rising troughs are the leak. If the line never returns to where it started, something is holding a reference it should have dropped.
The three-snapshot method
A single heap snapshot tells you what exists, which is nearly useless — of course a chat app holds messages. What you need is what survived something that should have cleaned up after itself.
So take three. Snapshot one on a clean load. Then perform the suspect cycle several times — open the chat panel, receive traffic, navigate away, come back, repeat five or ten times. Snapshot two. Then navigate away one final time, force garbage collection with the bin icon, wait a moment, and take snapshot three.
Now switch the summary dropdown to Comparison and diff snapshot three against snapshot one. Anything with a positive delta survived a full mount-and-unmount cycle. Those objects are your leak, and DevTools will name their constructors.
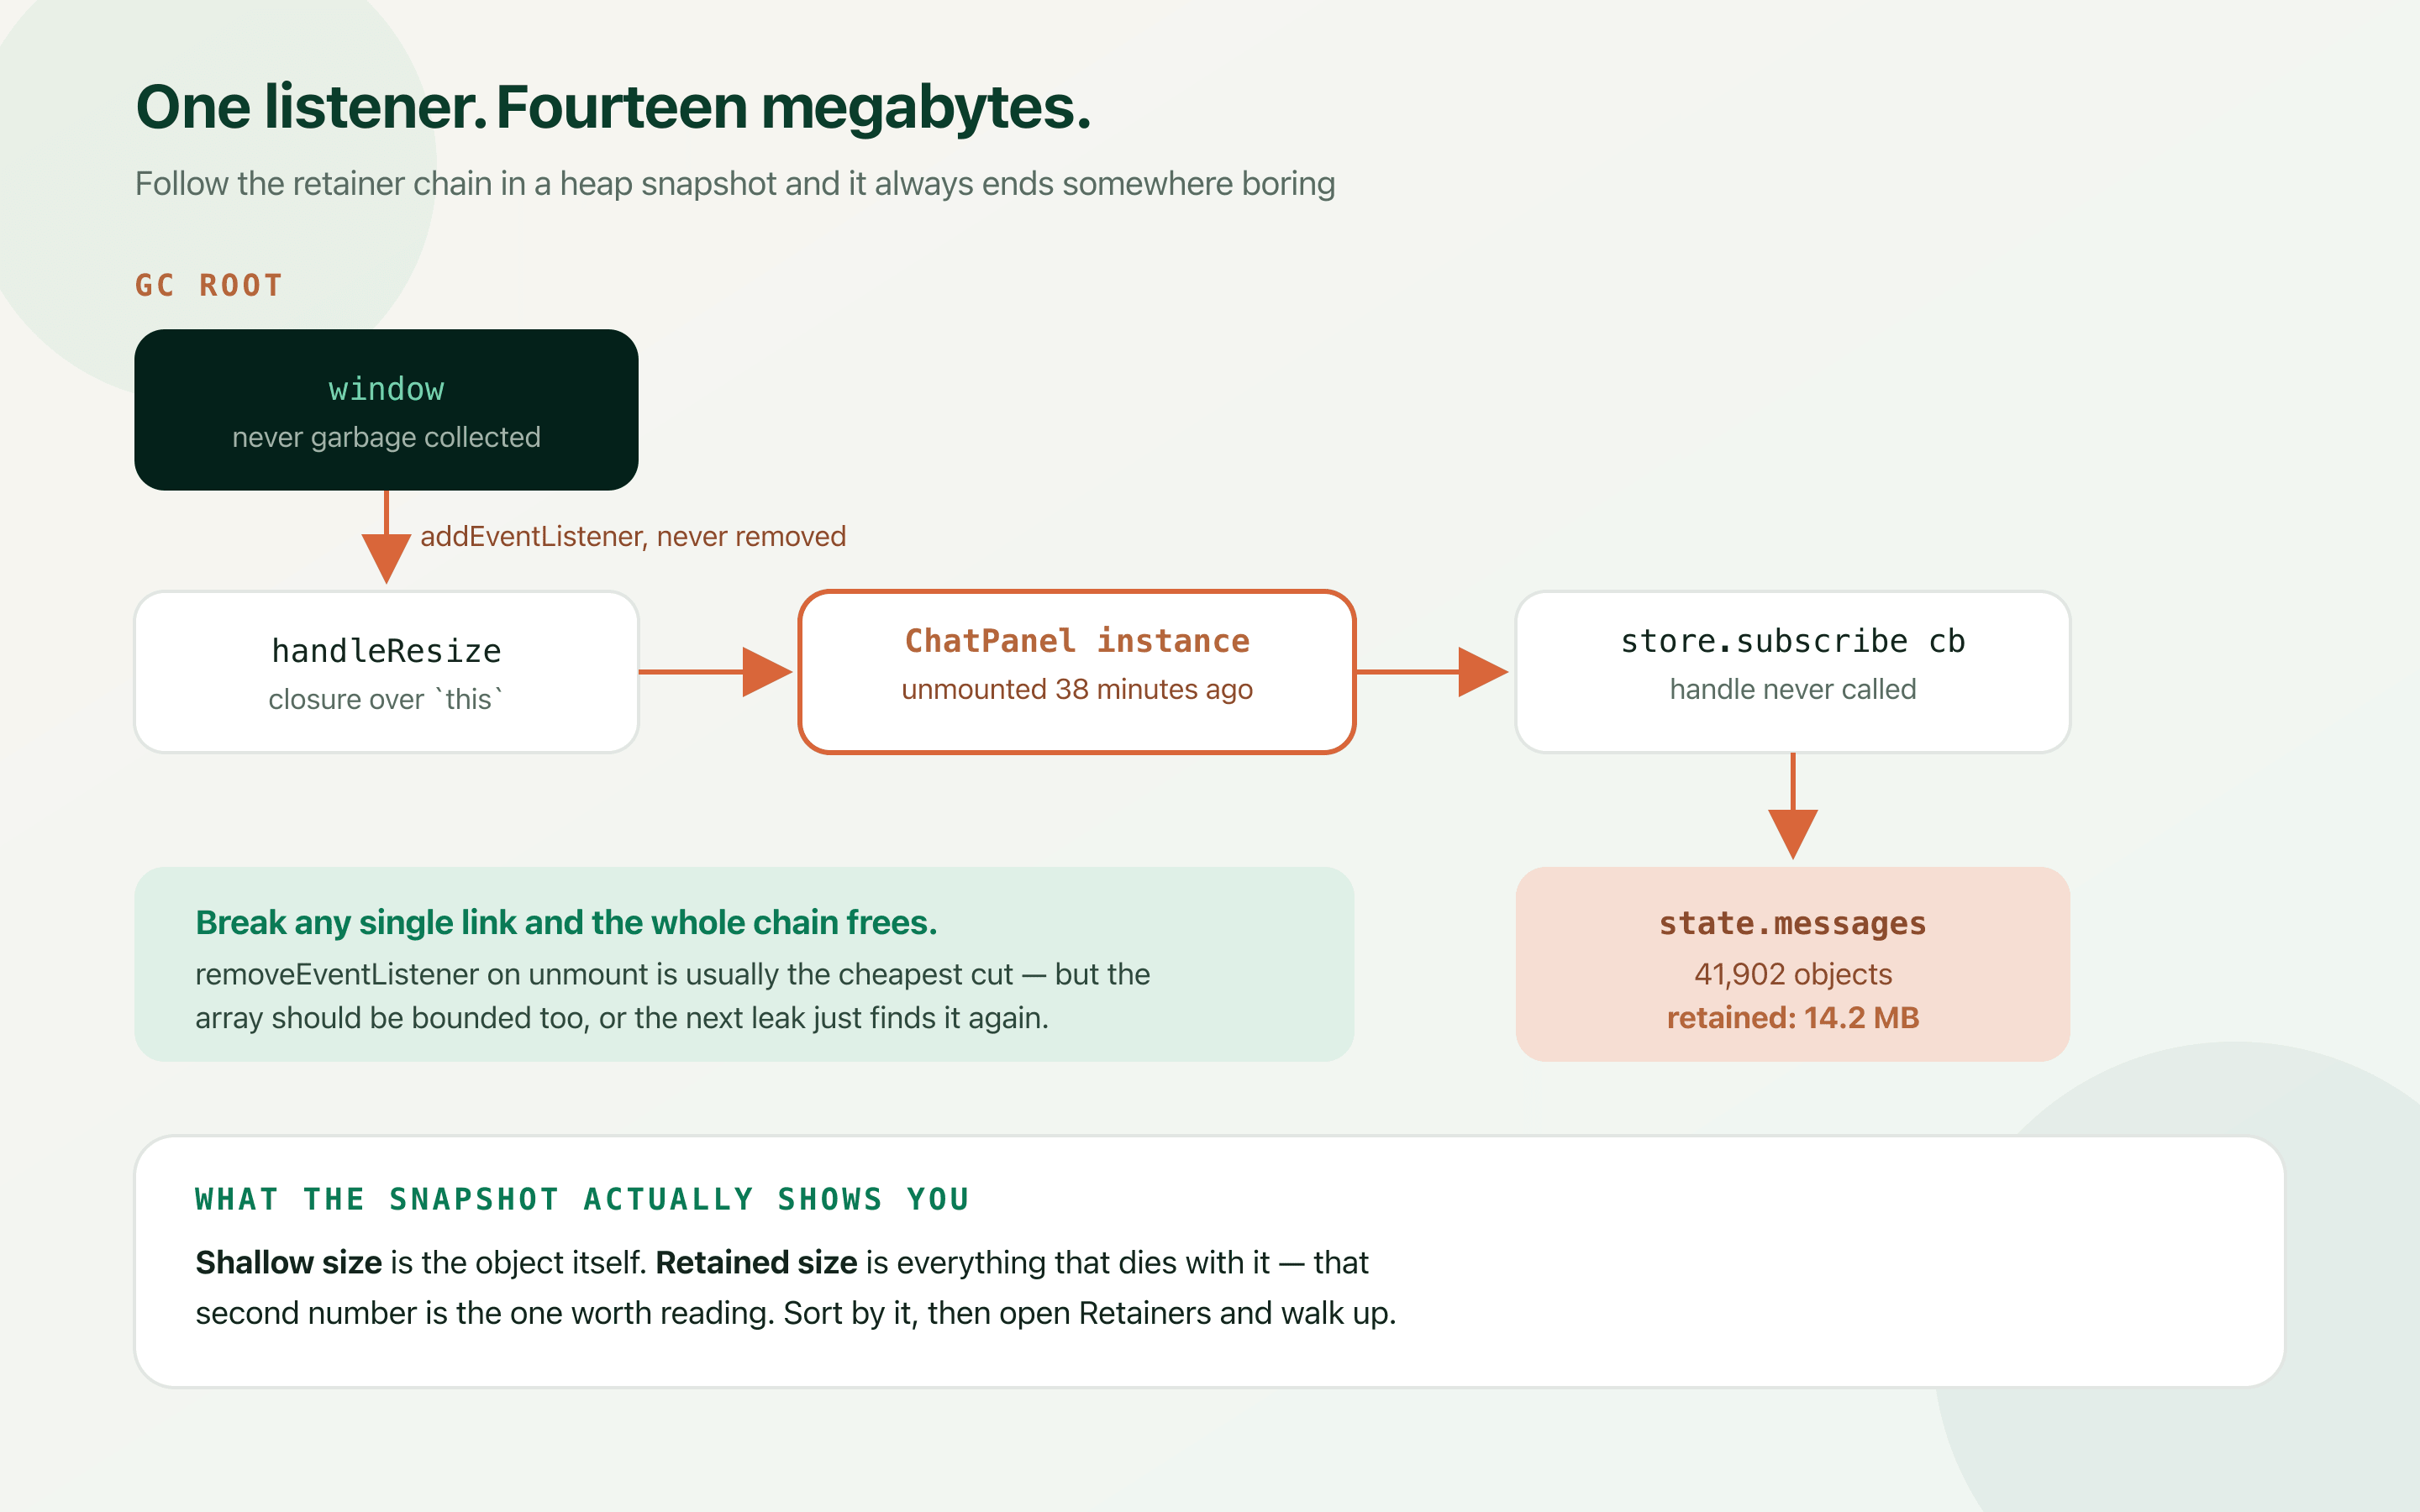
Sort by retained size, not shallow size. Shallow size is the object itself — a component instance is a few hundred bytes and looks harmless. Retained size is everything that would be freed if that object went away, which is how a “harmless” component instance turns out to be holding fourteen megabytes of message history.
- Filter by Detached in the class filter: Detached DOM nodes are elements removed from the document that JavaScript still references. A long detached list is a fast, unambiguous confirmation that something is holding component internals.
- Open the Retainers panel and walk up: Select a leaked object and the retainers tree shows the reference path keeping it alive, all the way to a GC root. That path is the bug — read it bottom to top.
- Force GC before the final snapshot: Without it you cannot distinguish “leaked” from “not collected yet”, and you will spend an afternoon chasing objects that were about to be freed anyway.
Leak 1 — the store array nobody bounded
This is the most common one and the least mysterious. A mutation pushes onto an array and nothing ever removes from it. In a chat panel receiving a few messages a second, that array holds tens of thousands of objects after an afternoon, and Vue's reactivity makes each one more expensive than a plain object because it is wrapped in a proxy.
The fix is to decide, deliberately, how much history the client needs. Almost always the answer is “what is on screen, plus a scroll buffer”, with anything older fetched back from the server on demand. Bound the array at the mutation, so it cannot grow regardless of which component is careless.
// Leaking: grows for as long as the tab is open
const mutations = {
  ADD_MESSAGE(state, message) {
    state.messages.push(message)
  },
}

// Bounded: a ring buffer with an explicit, reviewable limit
const MAX_MESSAGES = 500

const mutations = {
  ADD_MESSAGE(state, message) {
    state.messages.push(message)
    if (state.messages.length > MAX_MESSAGES) {
      // splice mutates in place, so reactivity is preserved
      state.messages.splice(0, state.messages.length - MAX_MESSAGES)
    }
  },
}

// Older messages come back from the API when the user scrolls up.
// The client is a window onto the history, not a copy of it.Leak 2 — every subscription needs an owner
store.subscribe, socket.on, an IntersectionObserver, a Vuex action that sets up a watcher — all of these return or imply a teardown handle, and all of them are routinely called without one. The callback closes over the component instance, the store holds the callback, and so the store now holds a component that was destroyed forty minutes ago.
This is the leak that produces the retention chain in the diagram above, and it is why the symptom is often not memory at all but duplicated work: five destroyed instances of a panel are all still reacting to every mutation, so the app does five times the work for one visible component.
The rule is simple enough to enforce in review: if a call returns an unsubscribe function, that function is called in onUnmounted. No exceptions, including “this component never unmounts” — components you thought were permanent are exactly the ones that get moved into a route later.
removeEventListener only works if you pass the same function reference you added. An inline arrow function can never be removed — it is a different object every time — which is why that pattern leaks silently.
// Leaking: the store keeps this callback, the callback keeps the component
export default {
  created() {
    this.$store.subscribe((mutation) => {
      if (mutation.type === 'ADD_MESSAGE') this.scrollToBottom()
    })
    window.addEventListener('resize', this.handleResize)
    this.timer = setInterval(this.pollPresence, 5000)
  },
}

// Fixed: hold the handles, release them on unmount
import { onMounted, onUnmounted } from 'vue'
import { useStore } from 'vuex'

export function useChatPanel(scrollToBottom, handleResize, pollPresence) {
  const store = useStore()
  let unsubscribe = null
  let timer = null

  onMounted(() => {
    unsubscribe = store.subscribe((mutation) => {
      if (mutation.type === 'ADD_MESSAGE') scrollToBottom()
    })
    window.addEventListener('resize', handleResize)
    timer = setInterval(pollPresence, 5000)
  })

  onUnmounted(() => {
    unsubscribe?.()
    window.removeEventListener('resize', handleResize)
    clearInterval(timer)
  })
}Leak 3 — timers and sockets that outlive the route
Reconnect logic is a reliable source of this. A socket disconnects, a setTimeout schedules a retry, the user navigates away, and the retry fires into a component that no longer exists — often re-establishing a subscription that then also leaks. Each navigation adds another orphaned reconnect loop, and the app slowly starts doing everything several times over.
Vue 3 gives you a tool built for exactly this. effectScope collects every reactive effect created inside it, so a single stop() disposes all of them without tracking each handle by hand. It is the right structure whenever setup logic lives outside a component's own lifecycle.
import { effectScope, watch } from 'vue'

export function createLiveFeed(store) {
  const scope = effectScope()
  let socket = null
  let retry = null

  scope.run(() => {
    watch(() => store.state.room.id, connect, { immediate: true })
  })

  function connect(roomId) {
    socket?.close()
    socket = new WebSocket('wss://example.test/rooms/' + roomId)
    socket.onclose = () => {
      clearTimeout(retry)
      retry = setTimeout(() => connect(roomId), 2000)
    }
  }

  // Disposes every watcher created in the scope, plus the socket and timer.
  return function dispose() {
    scope.stop()
    clearTimeout(retry)
    socket?.close()
  }
}Leak 4 — the same entity stored in three places
Deleting a message from state.messages does not free it if the same object is also in state.unread, state.threads[id].messages and a search result cache. You removed one reference out of four, and the object stays exactly as alive as it was before.
This is why normalised state is a memory concern and not only a tidiness one. Store entities once in a map keyed by id, and store arrays of ids everywhere else. Deleting from the map is then the only operation that has to succeed for the object to be collectable, and every list that referenced it is trivially cheap.
// Duplicated: the same message object lives in three arrays.
// Removing it from one changes nothing.
state = {
  messages: [{ id: 'm1', body: '...', author: {...} }],
  unread:   [{ id: 'm1', body: '...', author: {...} }],
  threads:  { t9: { messages: [{ id: 'm1', /* ... */ }] } },
}

// Normalised: one copy, three lists of ids.
// delete byId[id] is the single operation that frees it.
state = {
  byId:    { m1: { id: 'm1', body: '...', authorId: 'u4' } },
  allIds:  ['m1'],
  unread:  ['m1'],
  threads: { t9: { messageIds: ['m1'] } },
}| Symptom | What the snapshot shows | Usual cause |
|---|---|---|
| Steady climb during normal use | One constructor growing linearly, huge retained size | Unbounded store array — bound it at the mutation. |
| Step up on every route change | Multiple live instances of a component that is mounted once | Subscription or listener without a matching teardown. |
| Work happens 2×, then 3×, then 4× | Detached component instances still reacting to mutations | store.subscribe never unsubscribed. |
| Memory never drops after clearing a list | Objects retained by a second and third array | Denormalised state holding duplicate references. |
Prove it with a soak test, not a feeling
The thing that makes these bugs expensive is that “it feels better now” is not evidence. The failure takes an hour to appear, so a fix has to be verified over a comparable window, ideally automatically.
Drive the suspect cycle in a loop, sample the heap, and assert that the trend is flat rather than rising. Run it in CI on a schedule if the app is long-lived enough to matter — it is far cheaper than the support thread you get otherwise.
Baseline growth is not zero and should not be — caches fill and JIT warms up. What separates a leak from normal behaviour is that a leak never levels off.
// Playwright: mount, use, unmount, 200 times. Assert the trough is flat.
const samples = []

for (let i = 0; i < 200; i++) {
  await page.click('[data-test=open-chat]')
  await page.waitForSelector('[data-test=message]')
  await page.click('[data-test=close-chat]')

  if (i % 20 === 0) {
    const heap = await page.evaluate(async () => {
      if (window.gc) window.gc()             // run Chrome with --js-flags=--expose-gc
      await new Promise((r) => setTimeout(r, 300))
      return performance.memory.usedJSHeapSize
    })
    samples.push(heap)
  }
}

const first = samples[1]                      // skip warm-up
const last = samples[samples.length - 1]
const growth = (last - first) / first

// Some growth is normal (caches, code paths warming up).
// A leak is monotonic and does not level off.
expect(growth).toBeLessThan(0.15)
Frequently asked questions
How do I know if my Vue app has a memory leak or is just heavy?
Watch the JS heap in the Performance Monitor during normal use. A heavy app allocates a lot but returns to the same baseline after each garbage collection — a sawtooth with level troughs. A leaking app shows a staircase, where each trough sits higher than the last. Rising peaks are normal; rising troughs are the leak.
What is the difference between shallow size and retained size?
Shallow size is the memory the object itself occupies, usually a few hundred bytes for a component instance. Retained size is everything that would be freed if that object were collected, including everything it references. Sort heap snapshots by retained size — that is how a small component instance turns out to be holding megabytes of message history through a closure.
Does Vuex cause memory leaks?
Vuex does not leak by itself, but two of its features make leaks easy. Store state is global and lives for the whole session, so an unbounded array in state is never garbage collected. And store.subscribe holds your callback until you call the returned unsubscribe function, so a subscription created in a component keeps that component alive after it unmounts. Pinia has exactly the same characteristics.
Why does removeEventListener not stop my leak?
Almost always because the reference does not match. removeEventListener only removes a listener if you pass the identical function object you added, so an inline arrow function can never be removed — each render creates a new one. Store the handler in a variable or a method and pass that same reference to both calls.
How many messages should I keep in client state?
Enough to render the viewport plus a scroll buffer — a few hundred is typical for a chat interface — with older history fetched from the server when the user scrolls. Treat the client store as a window onto the data rather than a copy of it, and enforce the limit inside the mutation so no component can bypass it.
Can I detect leaks automatically in CI?
Yes, with a soak test. Drive the mount-unmount cycle a few hundred times in Playwright or Puppeteer, force garbage collection, sample performance.memory.usedJSHeapSize periodically, and assert that growth stays under a threshold. Allow some growth for caches and JIT warm-up — the signature of a real leak is that it is monotonic and never levels off.